New Relic vs DataDog: Both tools are popular for application and infrastructure monitoring, offering a wide range of features. This post compares New Relic and DataDog on key aspects like APM, log management, infrastructure monitoring, and OpenTelemetry support.
💡 I instrumented a sample Spring Boot Application and sent data to Datadog and New Relic to evaluate my experience. Some takeaways are subjective and based on personal preference.
Datadog vs New Relic: Overview
For application monitoring, both Datadog and New Relic offer the same features. The difference lies in the actual user experience. Datadog has features for security management like Cloud SIEM, which is lacking in New Relic.
My research found that Datadog gives you more granular controls, while New Relic feels simpler to start with.
Here’s a quick overview of the overall platform features and functionality of DataDog and New Relic:
| Feature | DataDog | New Relic |
|---|---|---|
| APM | ✅ Available | ✅ Available |
| Log Management | ✅ Available | ✅ Available |
| Infrastructure Monitoring | ✅ Available | ✅ Available |
| Network Monitoring | ✅ Available | ✅ Available |
| Cloud SIEM | ✅ Available | ❌ Not Available |
| Real User Monitoring | 🟡 Limited | ✅ Available |
| Application Security | ✅ Available | 🟡 Limited |
| Log Archives | ✅ Available | 🟡 Limited |
| Container Monitoring | ✅ Available | 🟡 Limited |
| Free Tier | ❌ Not Available | ✅ Available (100GB free data per month) |
These differences highlight the strengths and weaknesses of DataDog and New Relic, helping you choose the right observability platform for 2024 based on your specific needs.
For a deeper dive into the specific features and performance of New Relic vs DataDog, let's explore the detailed comparison in the sections below.
APM: Datadog for More Control, New Relic for Simplicity
I instrumented a sample Java application and sent data to both DataDog and New Relic for APM. The steps are almost the same in both DataDog and New Relic, with New Relic having a few extra steps. Both New Relic and DataDog require you to install their agent as well as a programming language-specific agent, which, in my case, was a Java agent.
DataDog APM
In DataDog, I had a hard time figuring out whether my setup was complete or not, and I found the onboarding flow of New Relic much better.
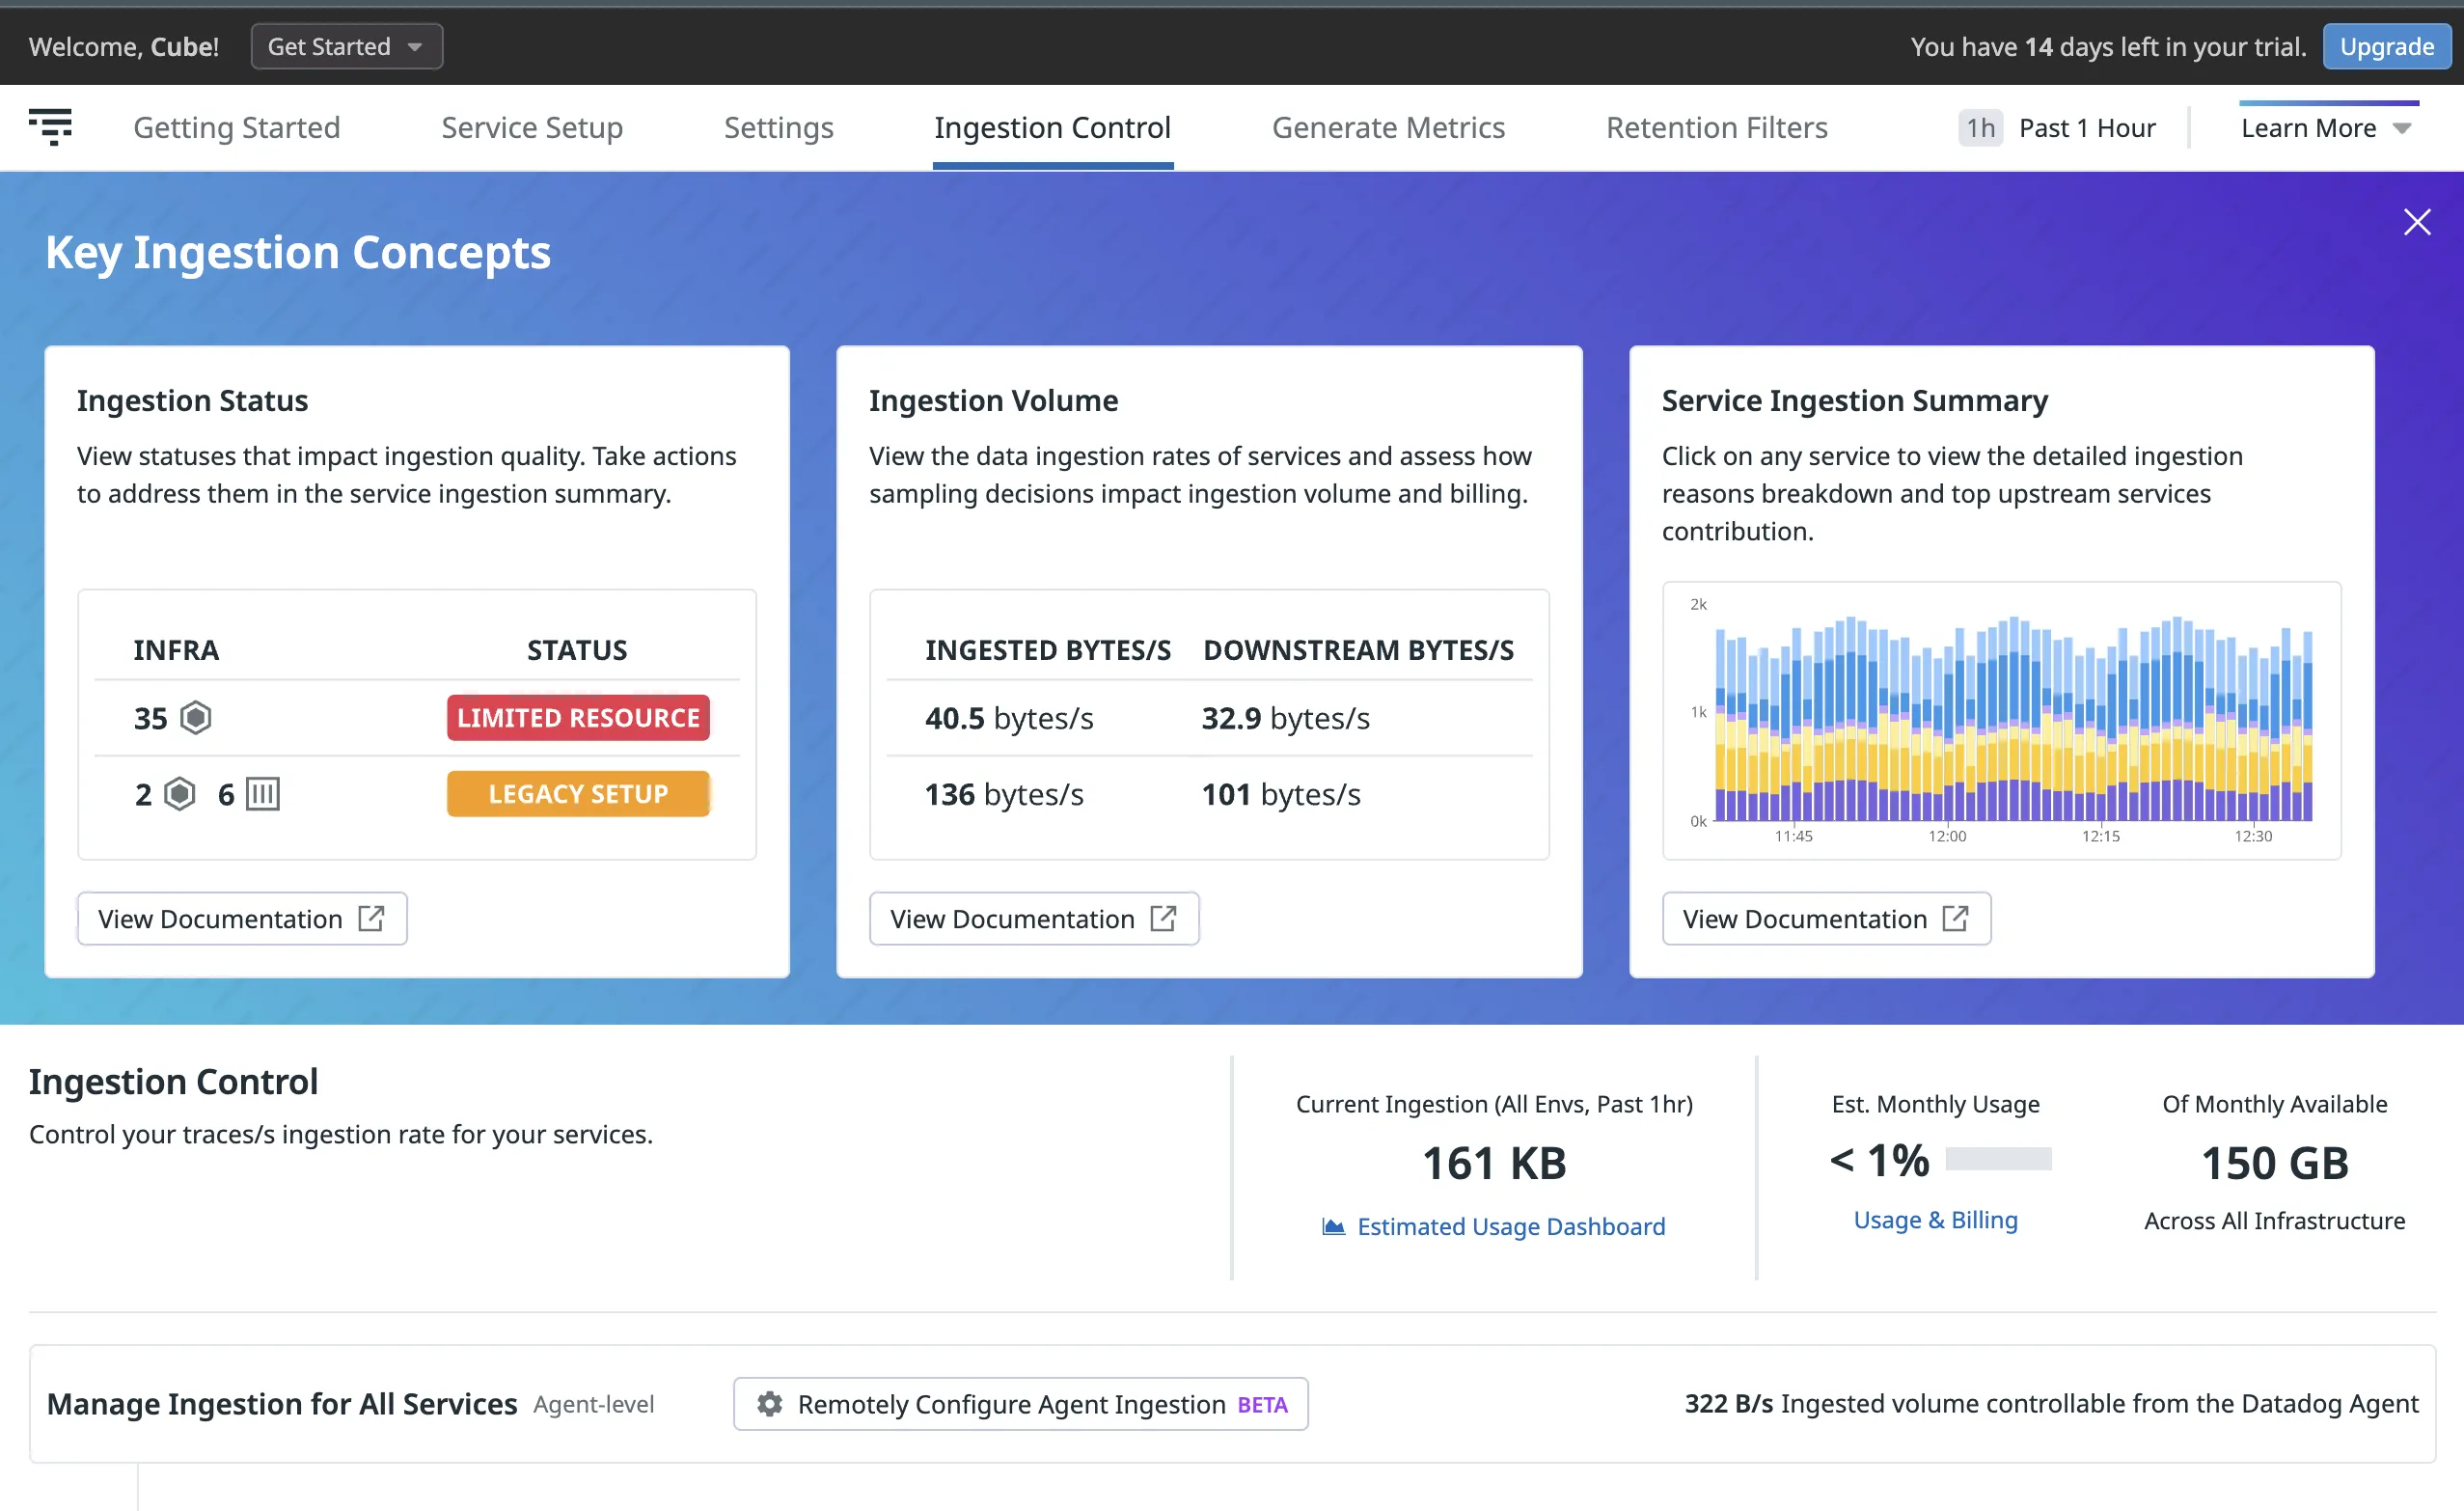
The good thing about DataDog is it gives you a lot of control. You can set up things like collecting custom metrics (which might be expensive), sampling rate, and telemetry correlation between traces and logs right from the beginning.
Once the setup is done, you can see your list of spans and corresponding flamegraphs for your traces. DataDog does a good job of correlating different types of signals. You can relate info from infrastructure, metrics, network, etc., right from trace data if you have those products enabled.
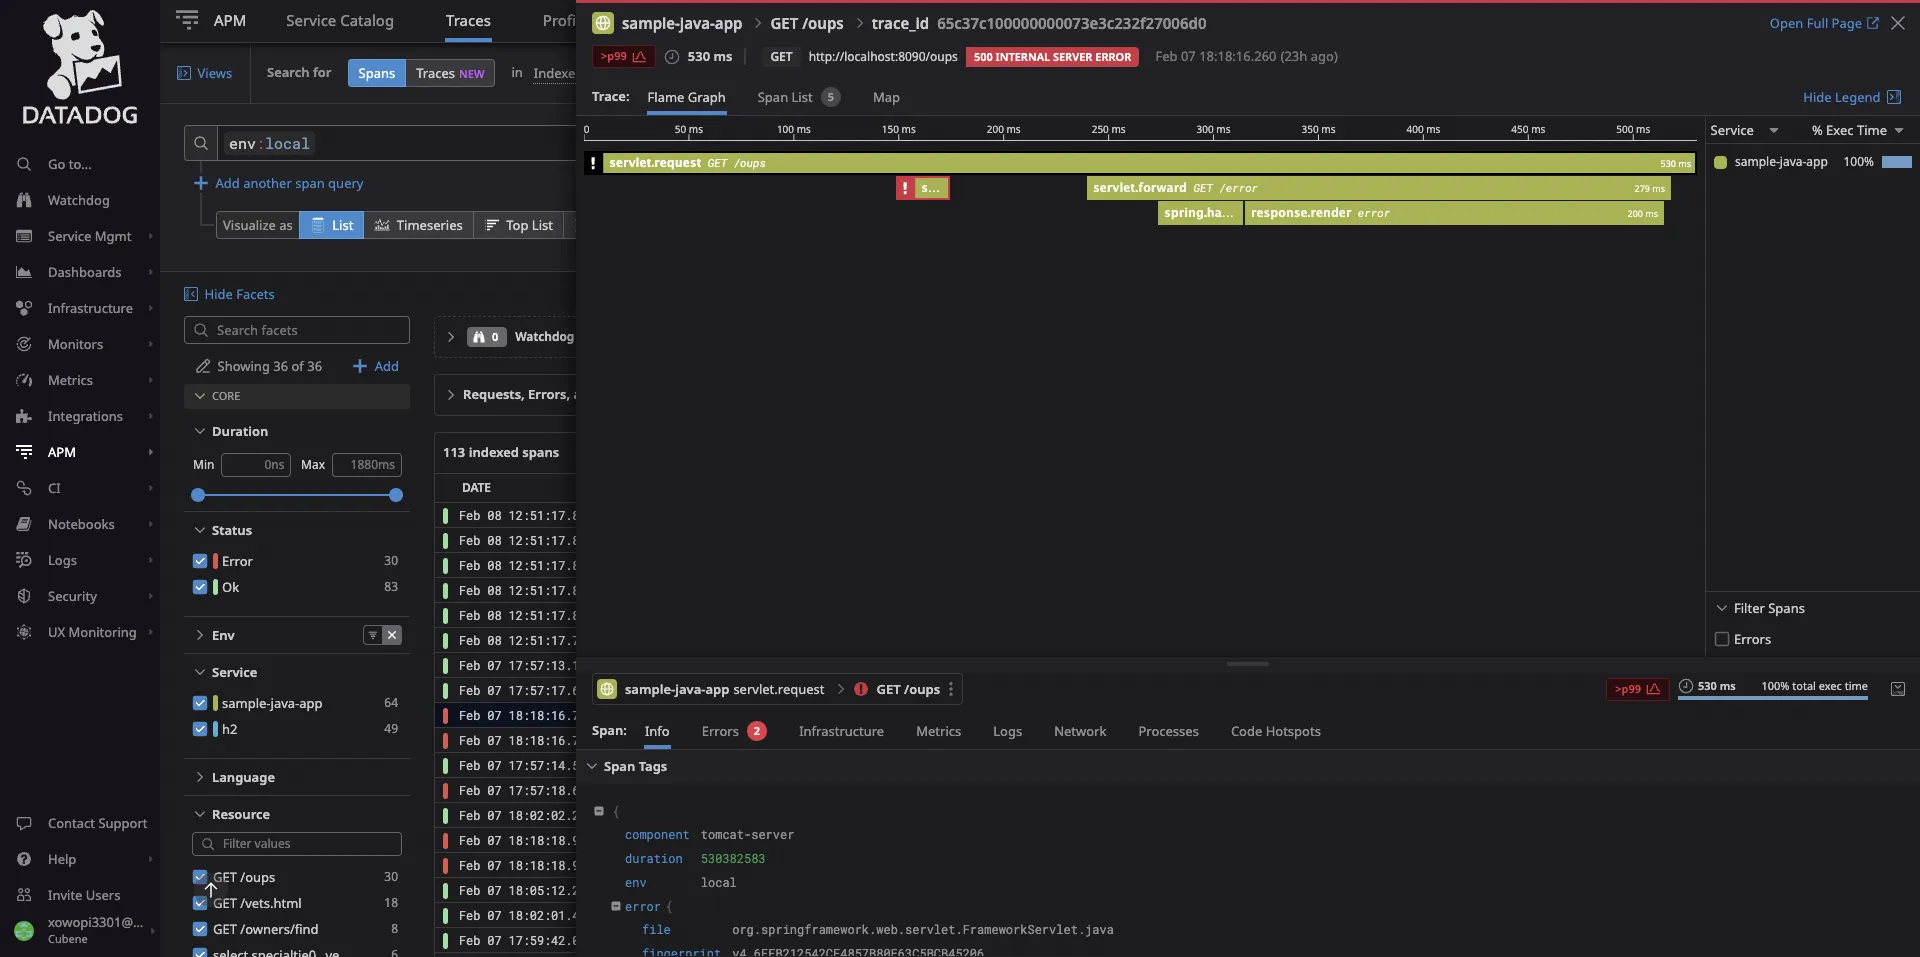
Some of the key features of DataDog APM include:
- ✅ Distributed tracing to track requests from user sessions to services and databases.
- ✅ Correlation of distributed traces to infrastructure and network metrics.
- ✅ Ingest 100% of traces from the last 15 minutes with retention of error and high latency traces.
- ✅ Code-level performance inspection and breakdown of slow requests.
New Relic APM
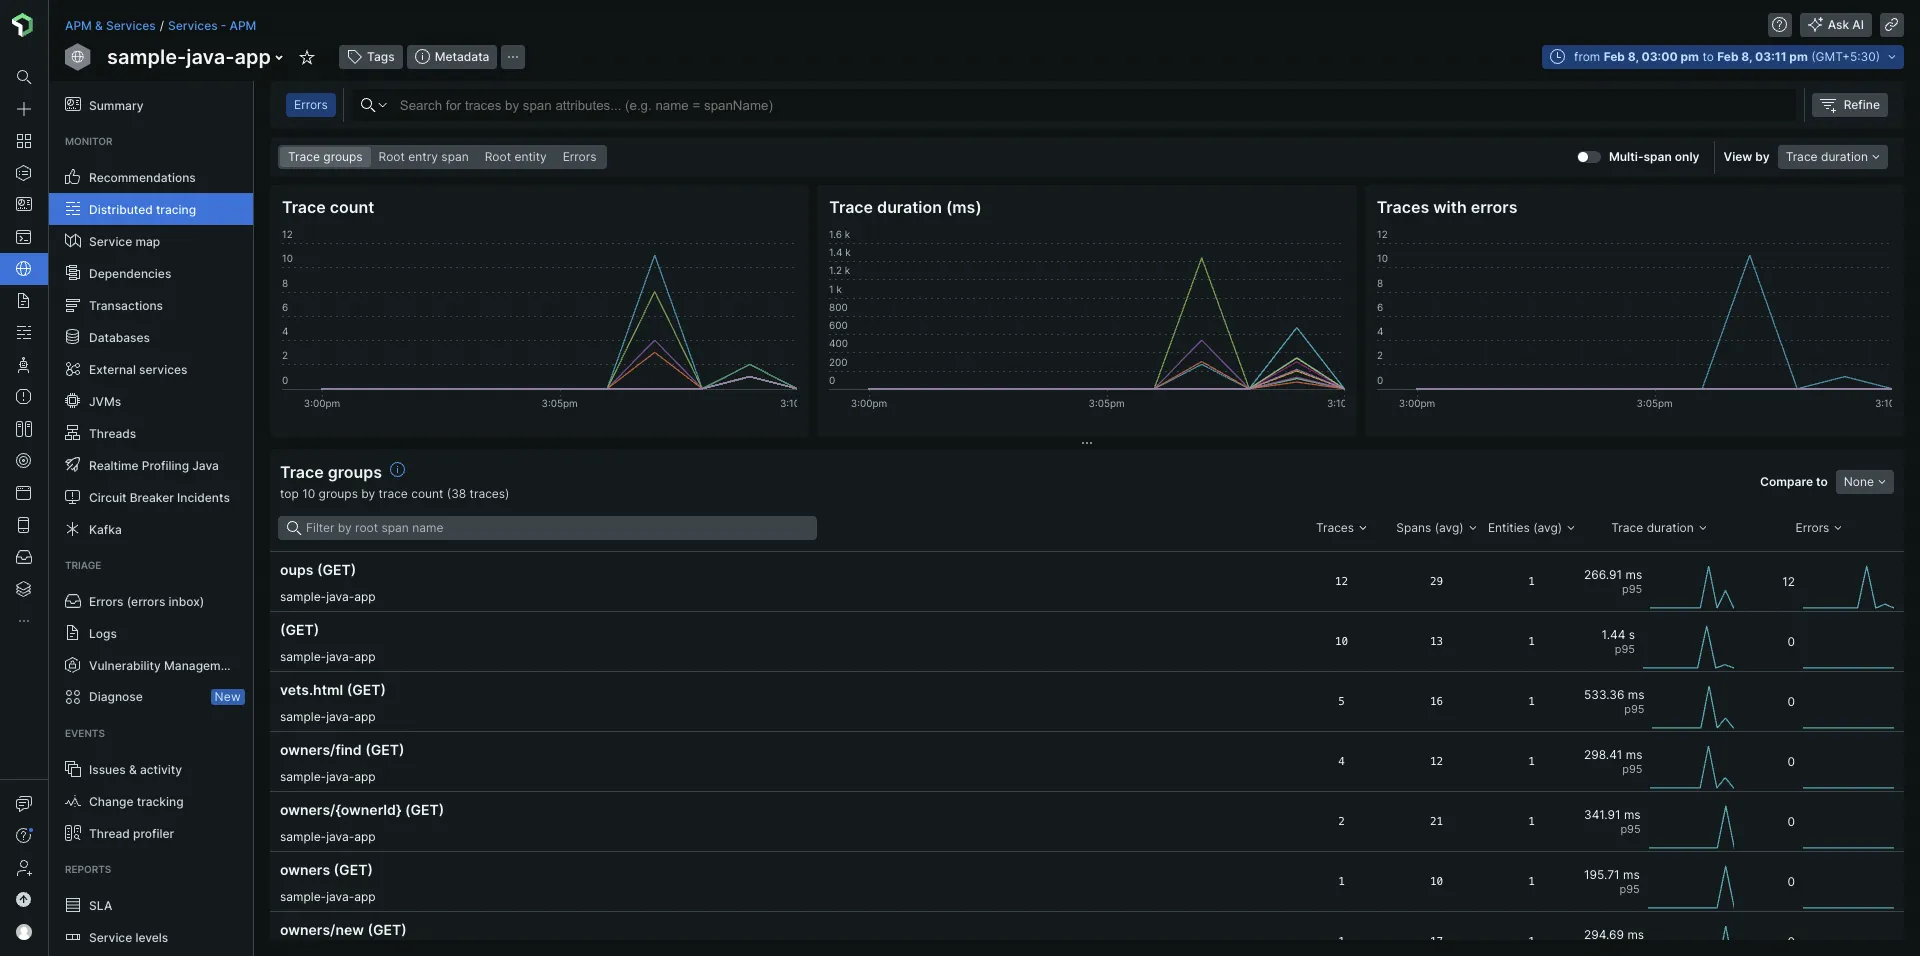
New Relic’s traces page shows trace groups instead of a list of spans, which feels like a cleaner representation, and you can filter by root spans, which comes in handy in case of large trace groups.
You can get flamegraphs for your traces in New Relic, too. Compared to DataDog, New Relic has fewer options for correlation. But it is interesting to note that New Relic shows many more spans for the same call in my Java application.
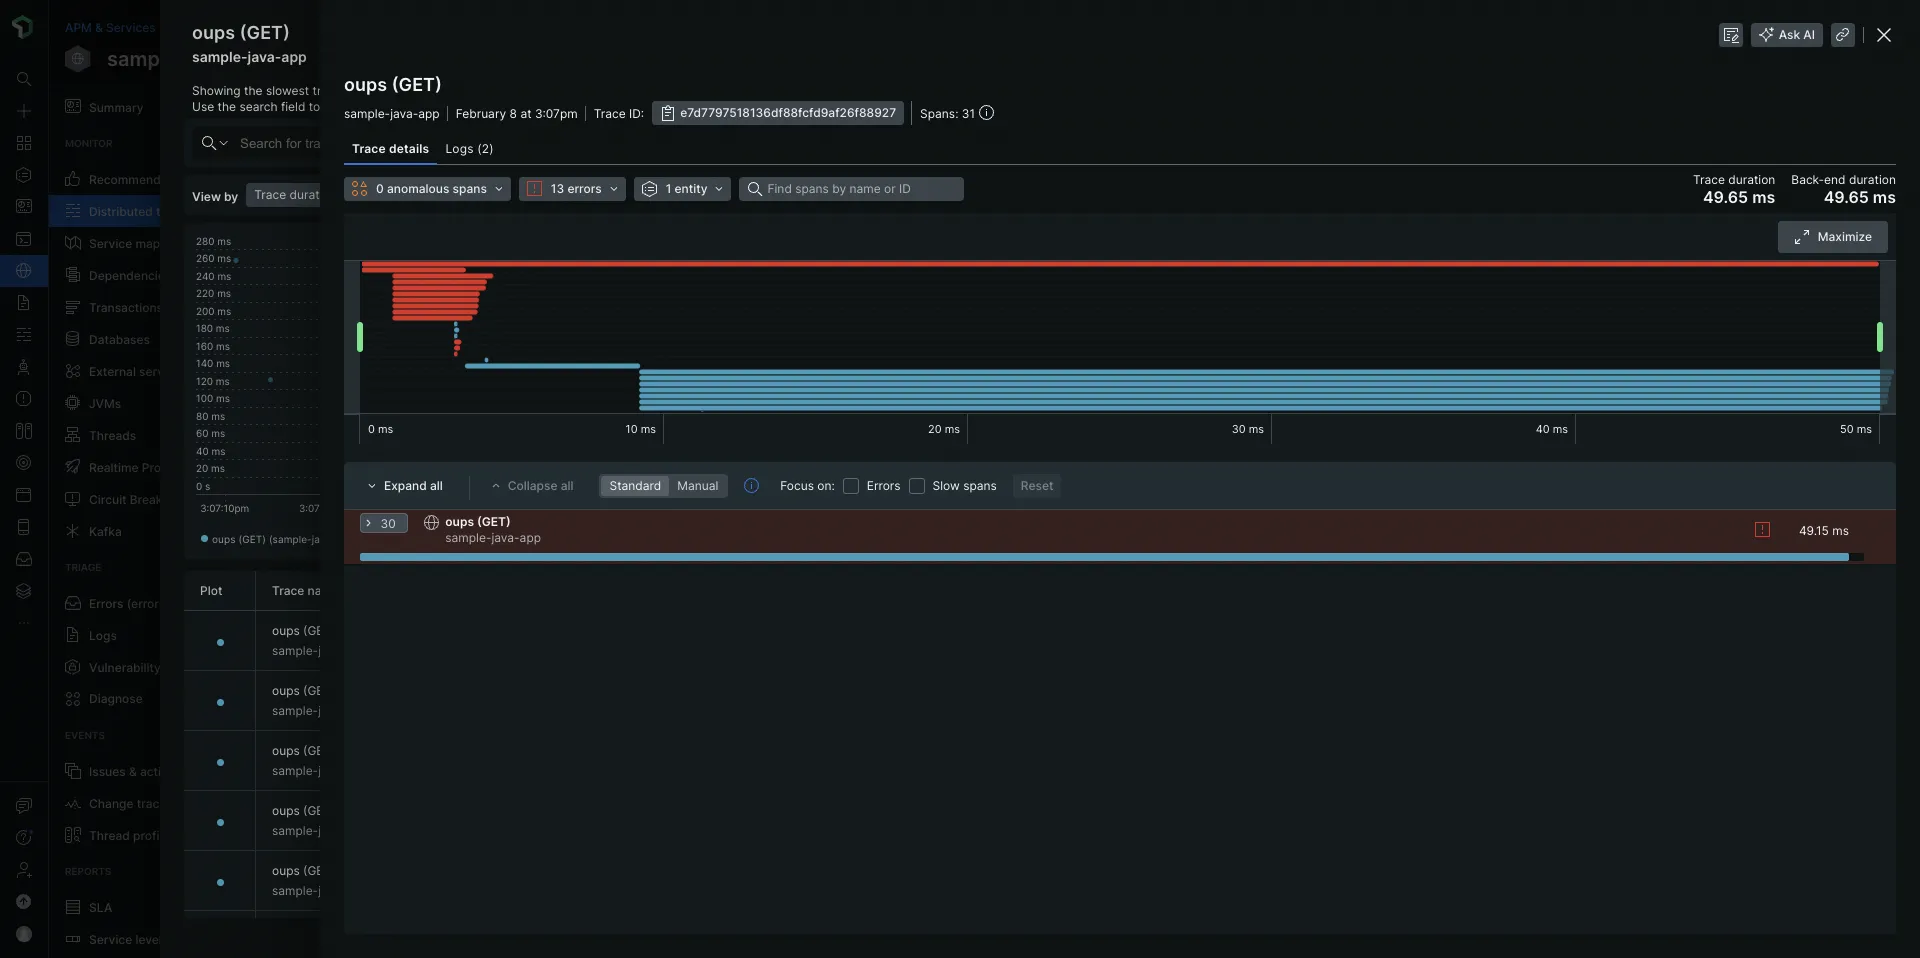
Some of the key features of New Relic APM include:
- ✅ Auto-instrumentation of eight programming languages: Java, .Net, Node.js, PHP, Python, Ruby, Go, and C/C++
- ✅ Distributed tracing and sampling options for a wide range of technology stacks
- ✅ Correlation of tracing data with other aspects of application infrastructure and user monitoring
- ✅ Fully managed cloud-native experience with on-demand scalability
Verdict: New Relic vs DataDog
Overall, if you need a simpler experience, then choose New Relic’s APM. But if you need more control over what things you can do with your data, then choose DataDog’s APM.
Let's dive deeper into the specific features and performance of New Relic vs DataDog in the next sections.
Log Management: DataDog for More Filters, New Relic for Quick-Start
New Relic Log Management
New Relic automatically collected logs from my Java application and displayed them in the logs tab. It allows you to search logs using Lucene, an open-source search library, and query log data using NRQL, a SQL-like query language developed by New Relic.
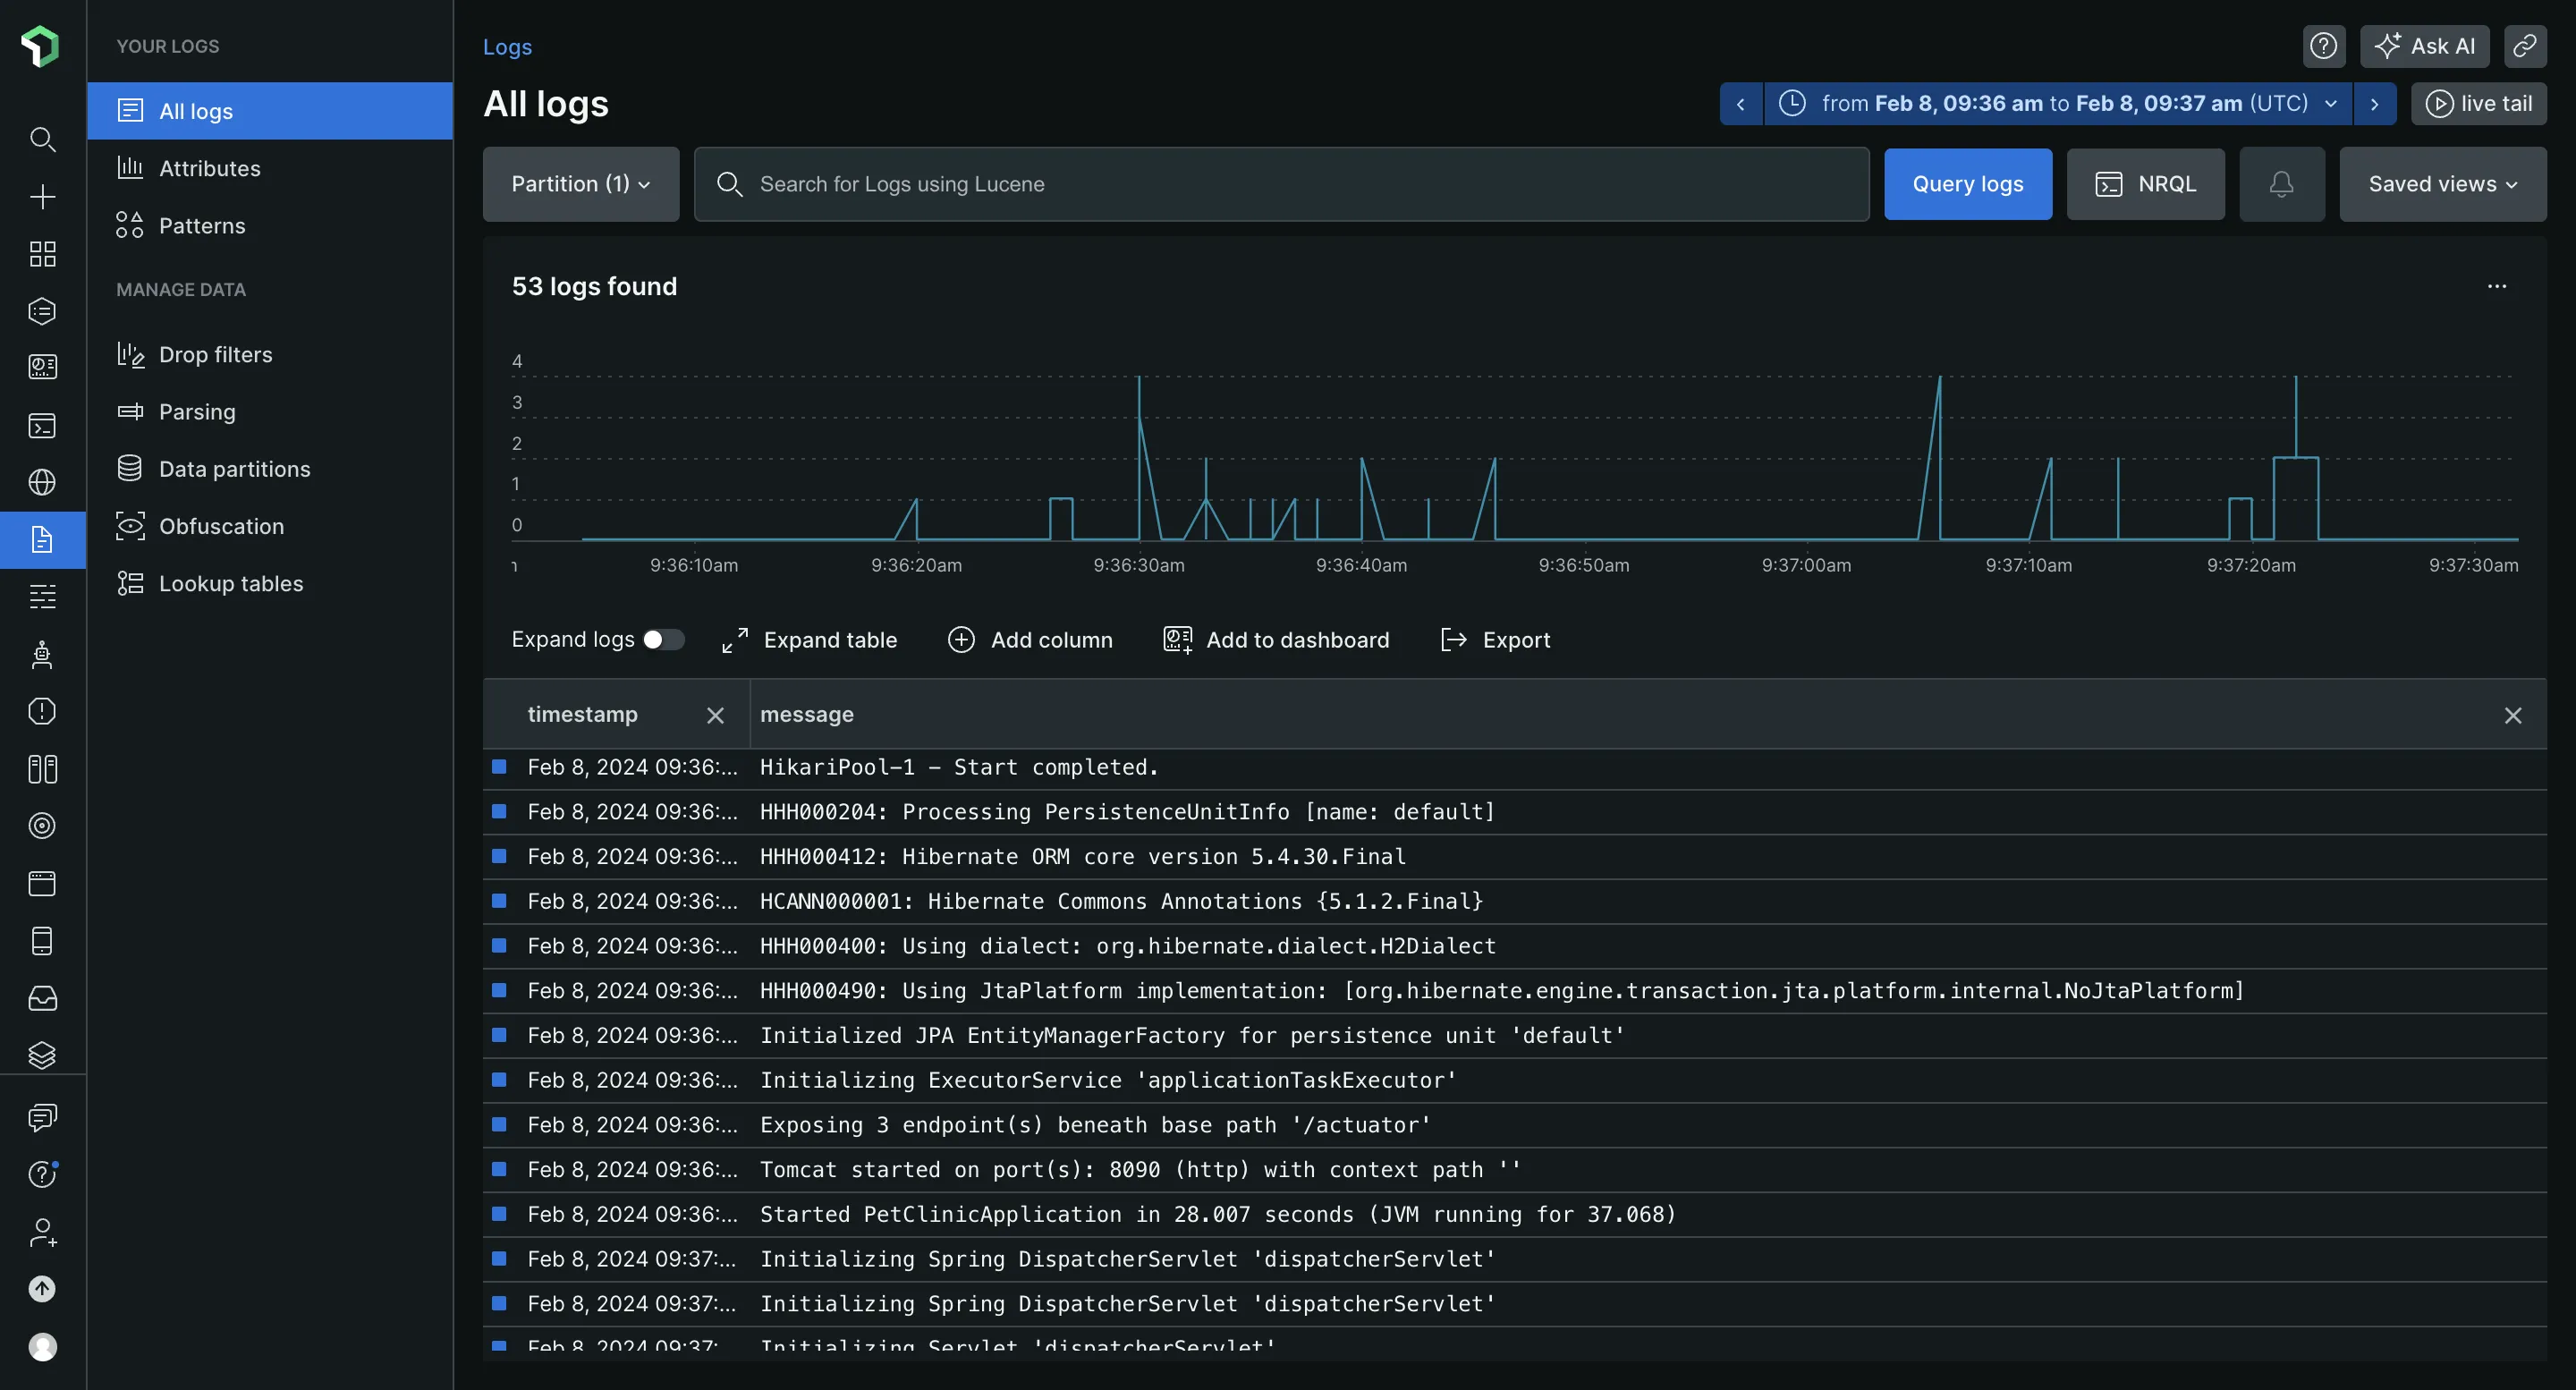
Key features of New Relic’s log management:
- Automatically extracts attributes from logs.

Attributes filtered from Java application logs in New Relic - Provides a feature called patterns for log data discoverability, though it didn’t detect any pattern in my Java application logs.
- Tools to manage log data by optimizing storage with dropping filters.
DataDog Log Management
For DataDog, automatic log collection is disabled by default and needs to be enabled in the agent’s config file, along with activating a Java integration for application logs collection.
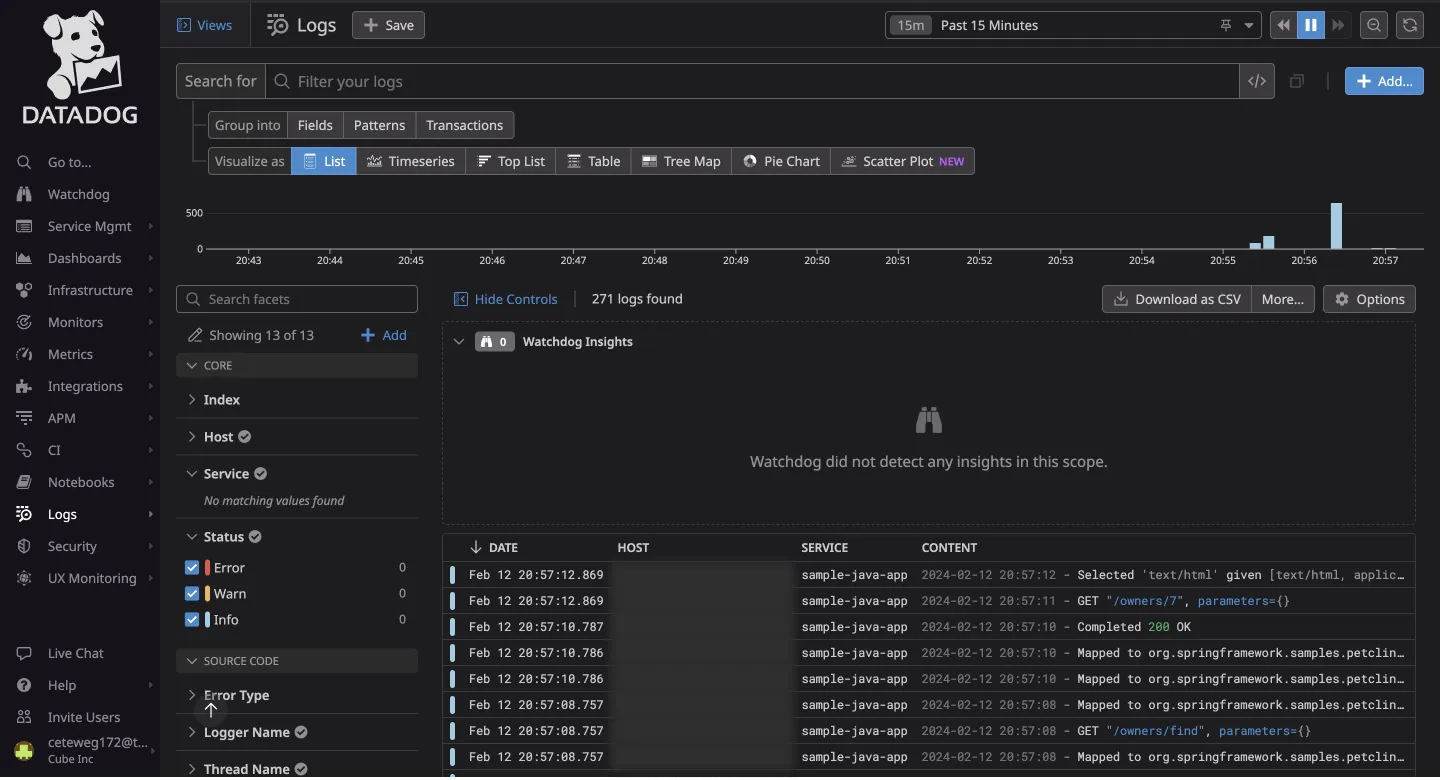
Both DataDog and New Relic offer log pattern detection, but DataDog identified patterns in my logs, while New Relic did not. DataDog provides more options to filter and visualize log data and allows the use of cloud storage for logs, useful for long-term storage.
Setting up log collection in DataDog took more time compared to New Relic, but DataDog offers more visualization options.
Verdict: New Relic vs DataDog
If you need a quick-start log management system, New Relic is the better choice with its automatic log collection and easy setup. However, if you require more control over filtering and visualizing logs, DataDog’s log management provides more advanced options.
Cut Your Observability Spend by 80%—Here’s How
Discover how SigNoz offers a seamless migration path from Datadog with comparable features and up to 80% cost savings.
Infrastructure Monitoring: Tie, Decide Based on Cost
Host monitoring in both DataDog and New Relic is good, and choosing one over the other can be a matter of personal choice. I personally like the color theme of New Relic and the representation of things like disk usage in a table.
DataDog Infrastructure Monitoring
What’s interesting about DataDog is that it showed me a glimpse of the JVM metrics dashboard while clicking on my host. DataDog has done a really good job at correlating different types of information collected from your application and host.
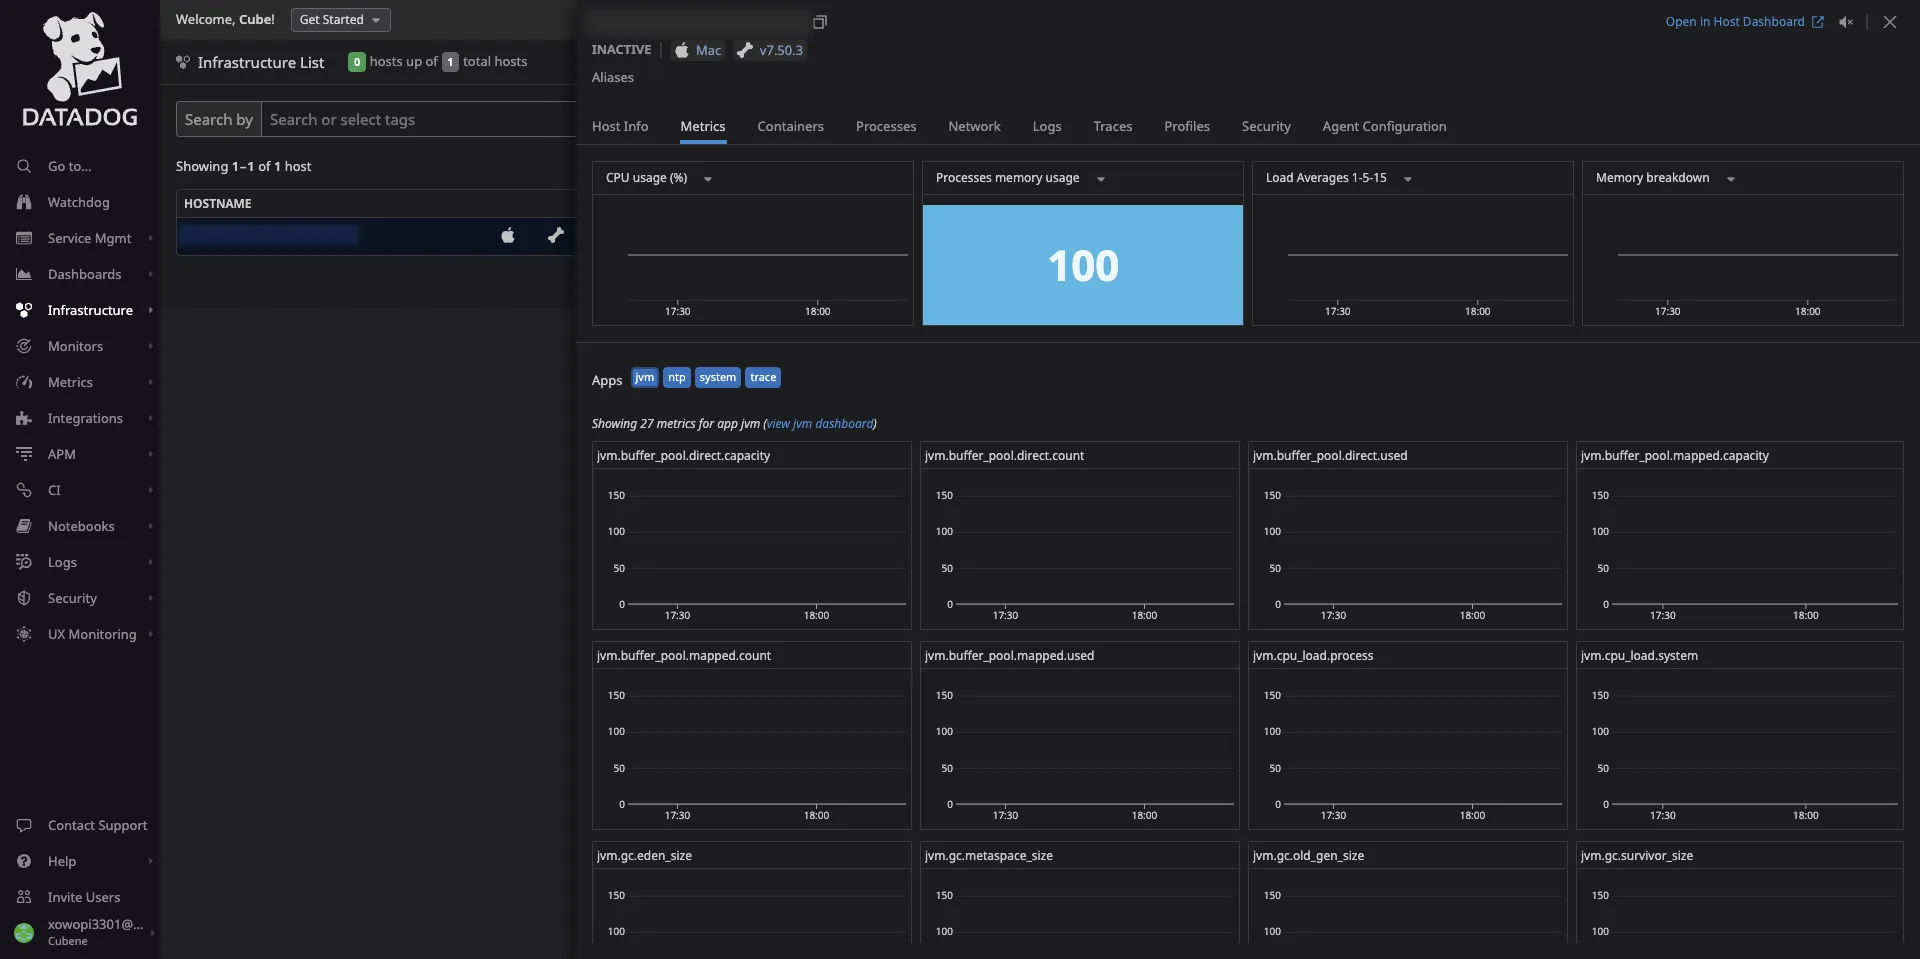
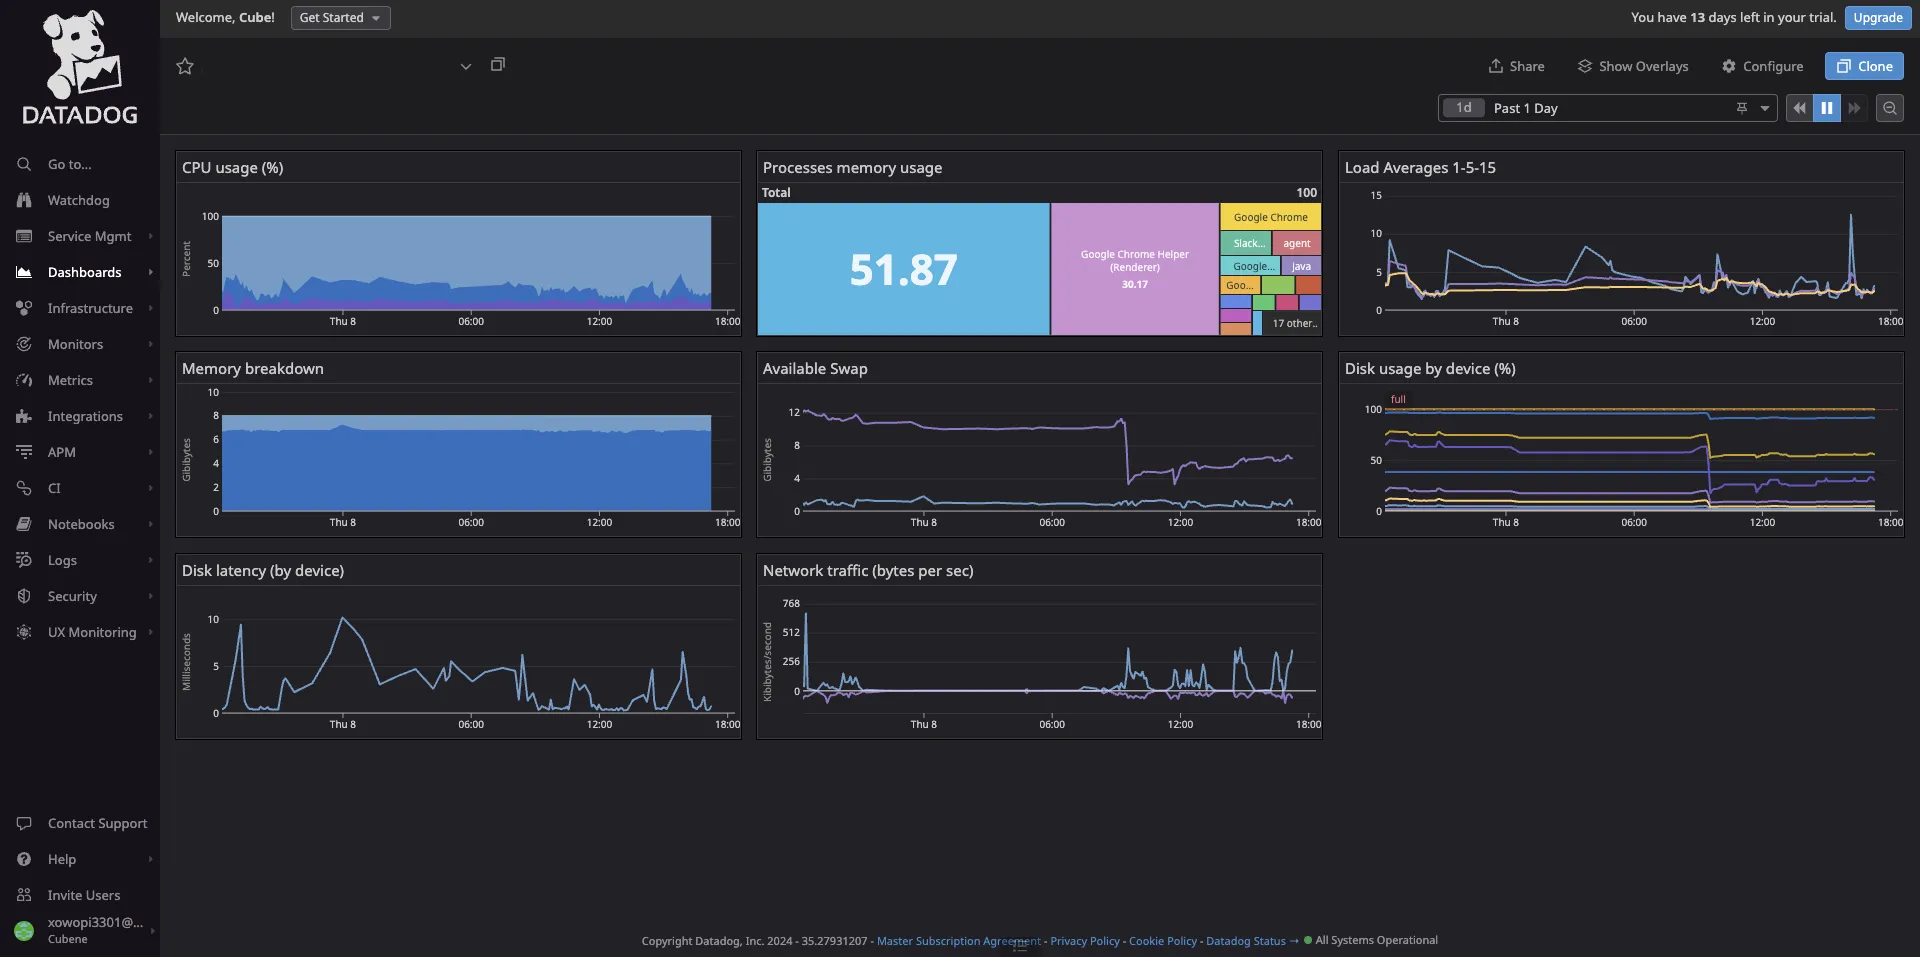
Some of the key features of DataDog's infrastructure monitoring include:
- ✅ You can see all your machines in the infrastructure list. Each machine/host has tags, aliases, and metrics attached to it.
- ✅ DataDog provides a Host map to visualize all your hosts on one screen.
- ✅ It also provides a container map and real-time monitoring of containers.
New Relic Infrastructure Monitoring
New Relic’s infrastructure monitoring provides robust features for connecting host performance with configuration changes.
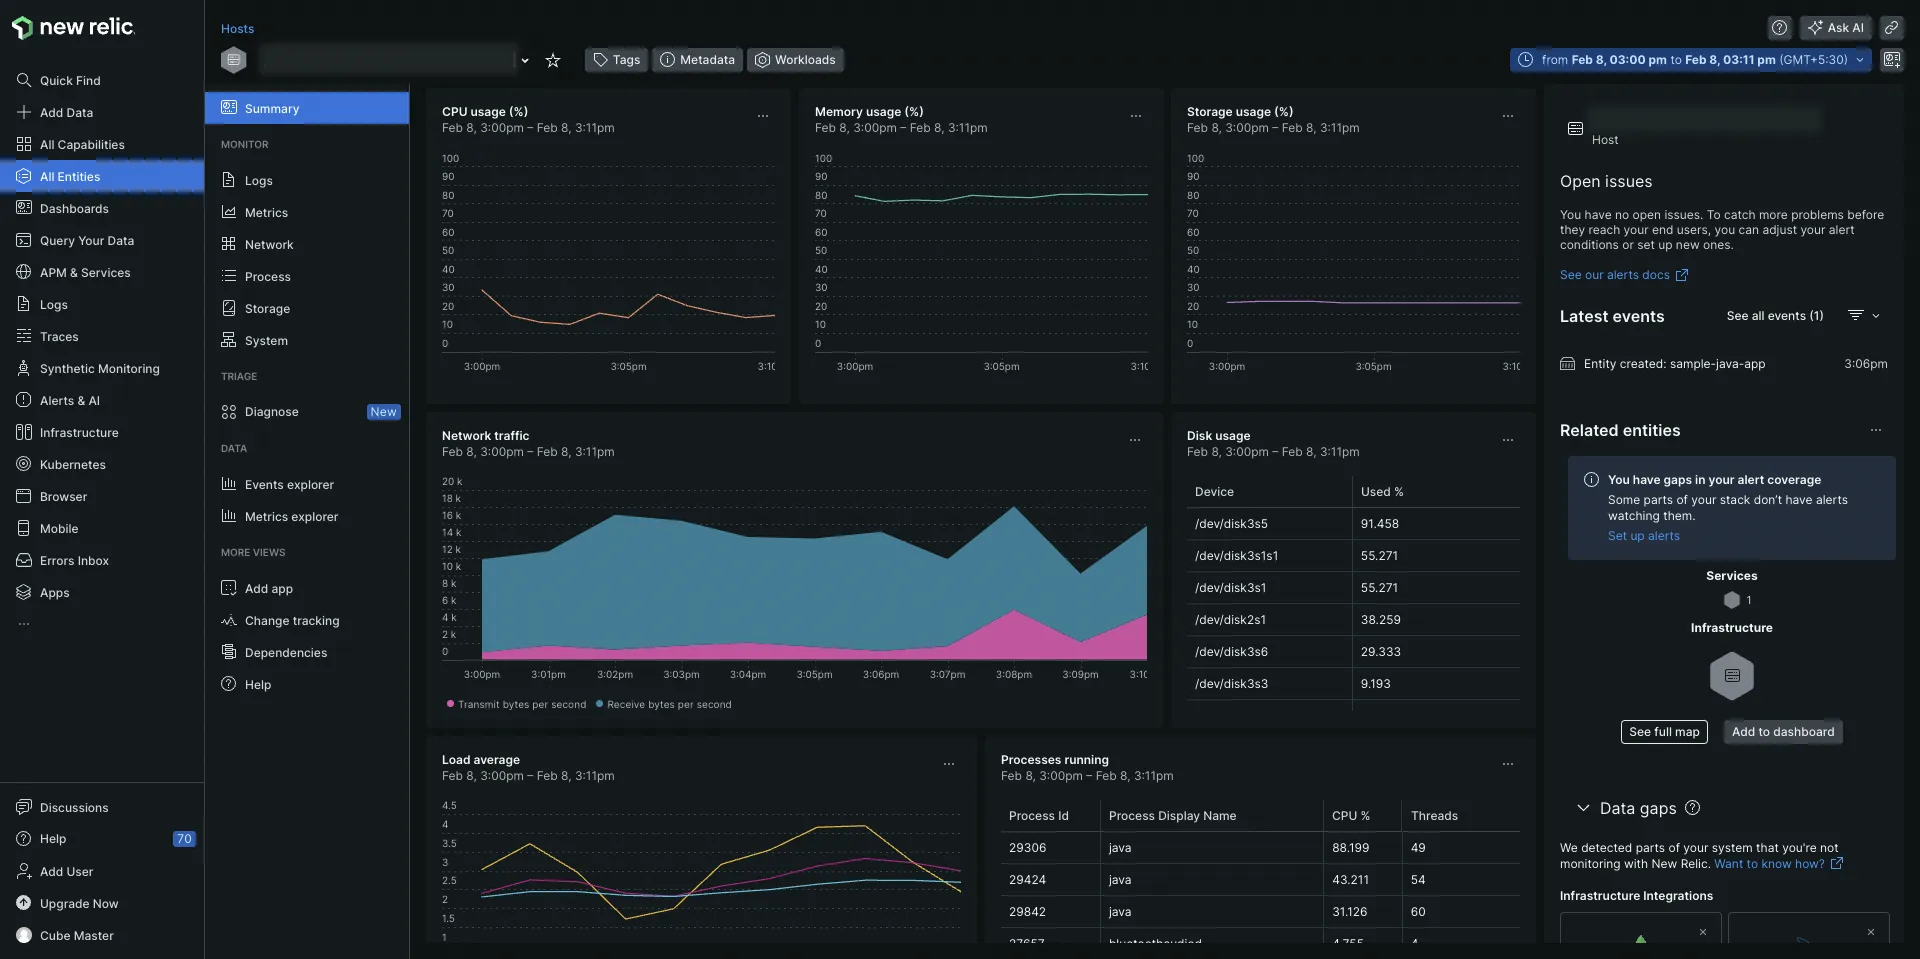
Some of the key features of New Relic infrastructure monitoring include:
- ✅ Connect changes in your host performance with your configuration changes.
- ✅ Troubleshoot performance issues by connecting the server-side to the application side if your infrastructure account is connected with the APM account.
- ✅ Provides integrations to collect metrics for popular platforms like AWS, GCP, Azure, Kubernetes, etc.
Verdict: New Relic vs DataDog
If your use case is only infrastructure monitoring, then the decision comes down to cost. However, it’s not easy to figure out how much each tool will cost on a head-to-head basis as their pricing structures are very different. I recommend you sign up and do a trial for both tools, including factors like user seats (New Relic charges for user seats).
Network Monitoring
DataDog Network Monitoring
DataDog offers robust network monitoring capabilities. Some of the key features include:
- ✅ Provides metrics for point-to-point communication within your infrastructure.
- ✅ Granular data for network flows in a multi-cloud environment with aggregation capabilities supported by tags.
- ✅ Automatically collects tags from more than 450 integrations, allowing you to see network volume between any two sets of tags.
New Relic Network Monitoring
New Relic provides comprehensive network monitoring solutions. Some of the key features include:
- ✅ Pre-configured dashboards for monitoring popular cloud services like Azure, AWS, and GCP, with dynamic alerting.
- ✅ Integrations with over 100 services, including advanced Kubernetes monitoring that correlates metrics from the application and the infrastructure. Check the full list of AWS, Azure, and GCP integrations.
Verdict: New Relic vs DataDog Network Monitoring
Both DataDog and New Relic offer strong network monitoring features. DataDog excels in granular data and multi-cloud environments, while New Relic shines with its pre-configured dashboards and extensive integrations. The choice between the two may come down to specific needs and preferences regarding integration and visualization capabilities.
Browser or Real-User Monitoring
DataDog Real-User Monitoring
DataDog provides end-to-end visibility into user journeys for mobile and web applications. Some of the key features include:
- ✅ Aggregated frontend performance metrics, with slicing and dicing capabilities by location, device, application, etc.
- ✅ Root cause analysis for slow loading times with visibility into code, network, and infrastructure.
- ✅ Customer segmentation using tags for real-time error tracking.
New Relic Browser Monitoring
New Relic monitors end-users using your application across web browsers, devices, operating systems, and networks. Some of the key features include:
- ✅ Full-stack visibility to identify end-user latency from backend or network issues.
- ✅ Session performance heatmaps showing user interaction with the webpage.
- ✅ JavaScript error analytics to track end-user steps leading to errors.
Verdict: New Relic vs DataDog Browser Monitoring
Both DataDog and New Relic offer comprehensive browser and real-user monitoring solutions. DataDog excels in providing detailed performance metrics and real-time error tracking, while New Relic offers robust session performance insights and JavaScript error analytics. The choice between them depends on your specific needs for frontend performance monitoring and error tracking.
Pricing: Beware of These Things
Both DataDog and New Relic are expensive tools. The following points might help you decide which tool is better suited for your needs:
New Relic
- Pricing is based on:
- Amount of data ingested
- User seats
- 100GB of free data ingestion each month.
- Post 100GB, you need to pay
0.3/GB or0.5/GB ingested based on your plan. - User seats can get expensive. New Relic allows only 5 full platform users in its standard plan, and the cost can be up to $549/user per month for enterprise plans.
DataDog
- DataDog is known for being very expensive - here’s a scoop on DataDog’s $65 million bill.
- Complex SKU-based pricing. Each product (like APM, logs, infra) is priced differently, making it hard to predict actual usage costs.
- DataDog defines its standard set of metrics; anything outside that definition falls under custom metrics. The cost of custom metrics can significantly impact your bill if not managed carefully.
OpenTelemetry Support: Not Great in Both Datadog & New Relic
OpenTelemetry is quietly emerging as the open-source standard for collecting all types of telemetry signals. There are numerous benefits to using OpenTelemetry for collecting telemetry data from your applications and host.
Both Datadog’s and New Relic’s support for OpenTelemetry is not up to the mark, which seems reasonable as their entire product is anchored around their specific agents.
For example, Datadog cannot link traces and logs automatically with the DataDog OpenTelemetry tools. New Relic’s documentation is better for using OpenTelemetry, but once the data gets reported, you can see the difference again.
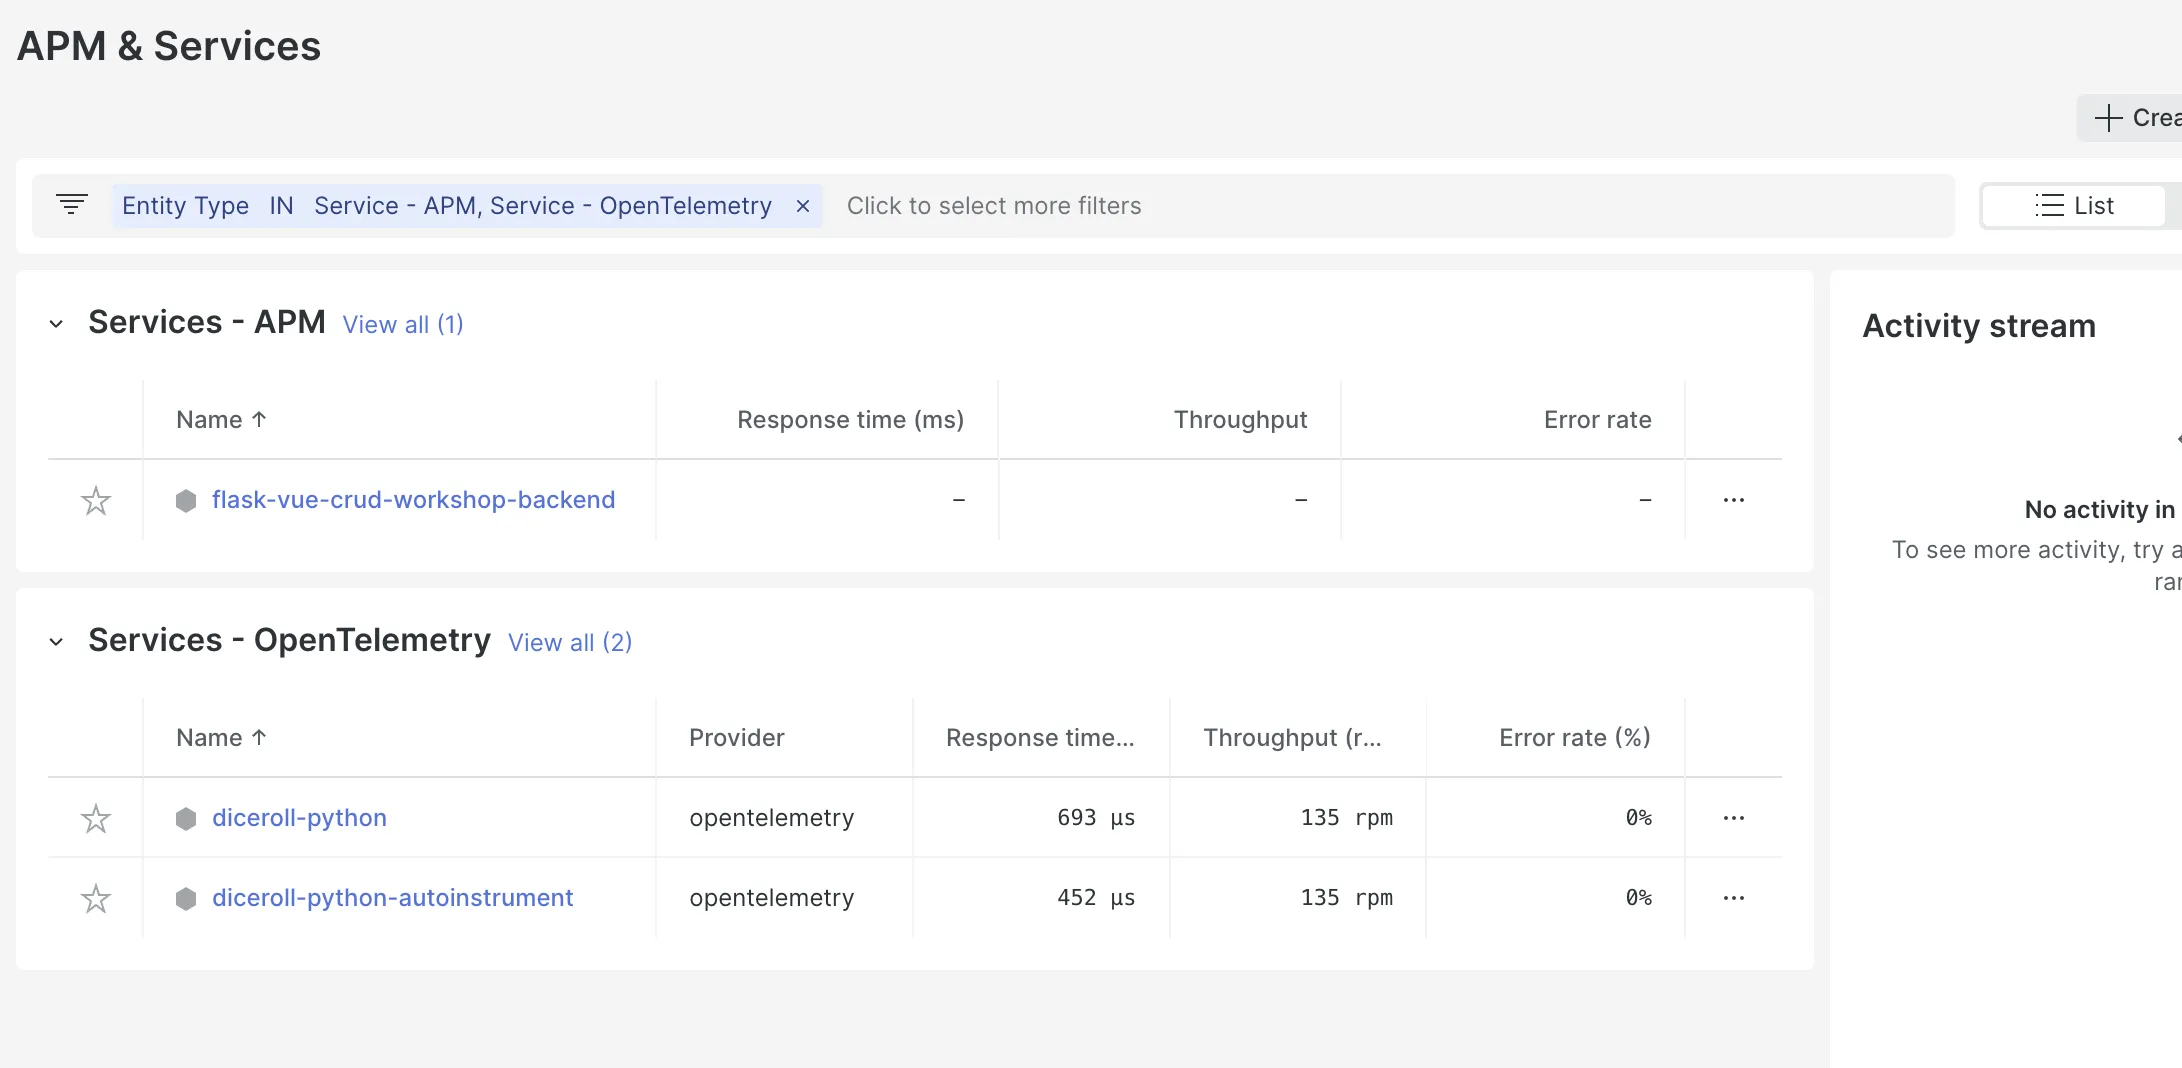
If you are looking to use OpenTelemetry, then I would recommend SigNoz (of course) - an OpenTelemetry-native APM. And just like OpenTelemetry, SigNoz is also open-source. So you can have a full-stack open-source observability stack with SigNoz and OpenTelemetry.
User Experience
DataDog User Experience
DataDog offers a comprehensive and detailed user interface that provides extensive customization options. However, the interface can be overwhelming for new users due to the sheer number of features and tabs. Advanced users appreciate the granular control over data and extensive integration capabilities.
New Relic User Experience
New Relic provides a simpler and more intuitive user interface, making it easier for new users to get started. The onboarding process is smoother, and the navigation is more straightforward. Customization options are available, but they may not be as extensive as DataDog's.
Verdict: New Relic vs DataDog
For a more streamlined and user-friendly experience, New Relic is preferable, especially for new users. DataDog, on the other hand, offers more customization and control, making it ideal for advanced users.
Datadog vs New Relic: Final Verdict
You should choose Datadog over New Relic if you are an observability expert and want more granular control over your data. That said, New Relic is not far behind in terms of features offered and can be a good solution for application observability.
Here’s a use-case-based guide for Datadog vs New Relic:
If you want a better correlation between your signals, then choose Datadog.
If you want to use the entire platform without worrying too much about billing, then choose New Relic, as the pricing is based on usage.
If you want more granular controls over your data, choose Datadog.
If your use case is Cloud SIEM, then choose Datadog.
If your use case is real-user monitoring, then choose New Relic.
Datadog and New Relic are great products for application monitoring and observability, but they come at a cost. Let's check out the issues generally faced with these solutions.
Issues with existing monitoring vendors
DataDog and New Relic are great monitoring tools and provide a gamut of monitoring products that any organization can use. But these enterprise monitoring tools can have the following issues:
Crazy node-based pricing Node-based pricing doesn’t make sense in today’s micro-services architecture. Any node which is live for more than 8hrs in a month is charged. So, unsuitable for spiky workloads
Very costly These tools are very costly if you want to do things like sending custom metrics.
Cloud-only Hence, not suitable for companies that have concerns with sending data outside their infra
Closed product roadmap For any small feature, you are dependent on their roadmap. We think this is an unnecessary restriction for a product which developers use. A product used by developers should be extendible
What the Community is Saying about New Relic vs DataDog
Reddit users have shared their experiences with Datadog and New Relic, highlighting various issues and insights:
Pricing Transparency and Cost Issues: Users often mention the unpredictable billing and high costs associated with both Datadog and New Relic. For instance, a user shared their frustration with Datadog's billing practices, noting a lack of transparency and delayed refunds for overcharges here.
Customer Support: Opinions on customer support vary. Some users report positive experiences with Datadog's customer support, finding it responsive and helpful. Others have had less favorable interactions, especially with New Relic, citing slow response times and a lack of proactive support for smaller companies here.
Cost Management Strategies: Users discuss various strategies to manage and reduce costs, such as setting up retention filters in Datadog to minimize data ingestion and storage costs. These strategies can lead to significant savings, but they also highlight the complexity and effort required to optimize usage here.
The other alternative can be going for an open-source solution. But the problem with most open-source products is that they are resource-intensive to set up, maintain and scale up. That's where SigNoz comes into the picture. SigNoz is a full-stack open-source APM platform with easy configuration and scalable architecture.
An alternative to DataDog and New Relic - SigNoz
SigNoz is a full-stack open-source application performance monitoring and observability tool which can be used in place of DataDog and New Relic. SigNoz is built to give SaaS like user experience combined with the perks of open-source software. Developer tools should be developer first, and SigNoz was built by developers to address the gap between SaaS vendors and open-source software.
Key architecture features:
Logs, Metrics, and traces under a single dashboard
SigNoz provides logs, metrics, and traces all under a single dashboard. You can also correlate these telemetry signals to debug your application issues quickly.Native OpenTelemetry support
SigNoz is built to support OpenTelemetry natively, which is quietly becoming the world standard to generate and manage telemetry data.

Architecture of SigNoz with ClickHouse as storage backend and OpenTelemetry for code instrumentatiion
SigNoz comes with out of box visualization of things like RED metrics.

SigNoz UI showing application overview metrics like RPS, 50th/90th/99th Percentile latencies, and Error Rate
You can also use flamegraphs to visualize spans from your trace data. All of this comes out of the box with SigNoz.

You can use logs to dig deeper into application issues.
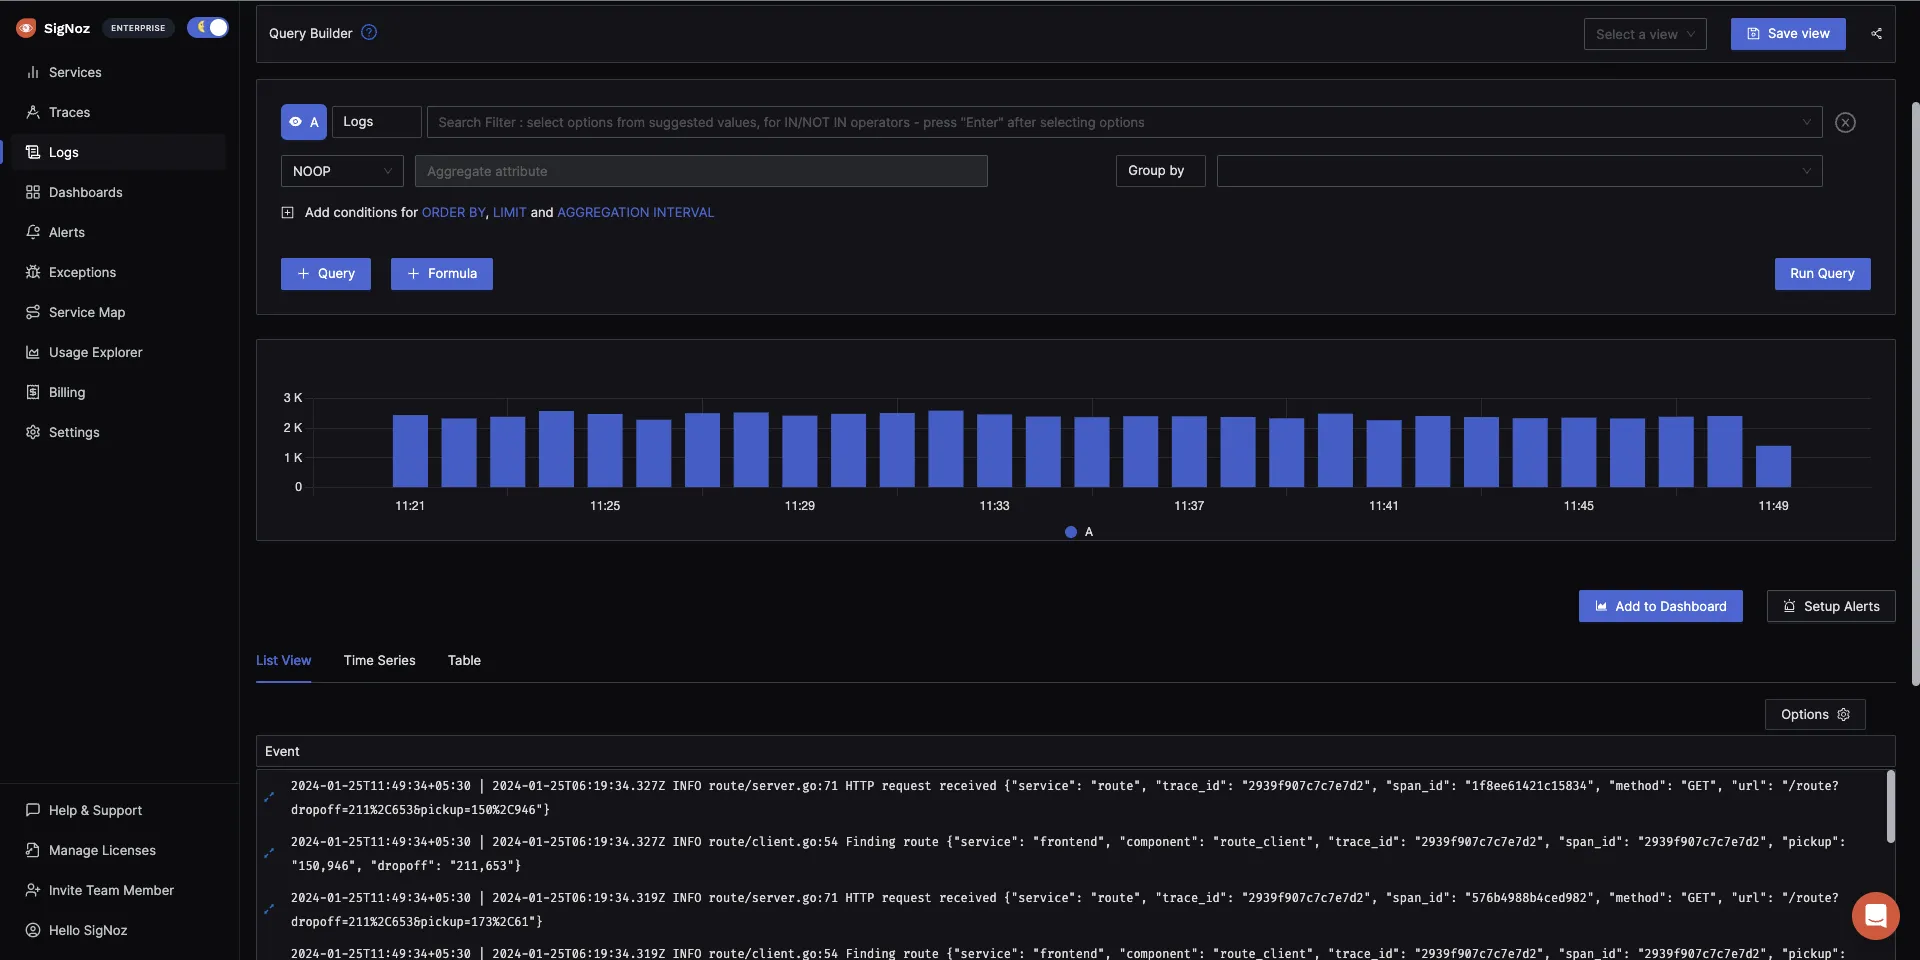
You can also build custom metrics dashboard for your infrastructure.
The logs tab in SigNoz has advanced features like a log query builder, search across multiple fields, structured table view, JSON view, etc.

No user-based & host-based pricing
You can add as many team members as you like when using the SigNoz cloud service. There is no charge for user seats in SigNoz. There is also no host-based pricing. You only pay for the amount of data you send.No special pricing for custom metrics
Custom metrics are important for getting application-specific insights. You understand your business best, so only you will be able to decide what things need to be monitored. Sending custom metrics in Datadog can get really expensive, and there are many horror stories about unpredictable billing in Datadog.
Some of the things SigNoz can help you track:
- Out-of-the-box charts for application metrics like p90, p99, latency, error rates, request rates, etc.
- Distributed tracing to get end-to-end visibility of your services
- Monitor any metrics important to you, build dashboards for specific use-cases
- Logs Management equipped with a powerful search and filter query builder
- Exceptions monitoring to track exceptions in your application
- Easy to set alerts with DIY query builder
- Native support for OpenTelemetry native
Getting Started with SigNoz
SigNoz cloud is the easiest way to run SigNoz. Sign up for a free account and get 30 days of unlimited access to all features.
You can also install and self-host SigNoz yourself since it is open-source. With 19,000+ GitHub stars, open-source SigNoz is loved by developers. Find the instructions to self-host SigNoz.
FAQs
Is Datadog better than New Relic?
The choice between DataDog and New Relic depends on your specific needs. DataDog offers more granular control and better correlation between signals, while New Relic provides a simpler user experience and pricing based on usage.
What is the difference between Grafana vs Datadog vs New Relic?
Grafana is primarily a visualization tool, whereas DataDog and New Relic are comprehensive monitoring solutions. DataDog provides extensive integrations and detailed monitoring capabilities, while New Relic offers an easy-to-use platform with strong real-user monitoring features.
Is New Relic a monitoring tool?
Yes, New Relic is a comprehensive monitoring tool that provides application performance monitoring (APM), infrastructure monitoring, real-user monitoring, and more.
What is better than Datadog?
Depending on your specific requirements, alternatives like New Relic, Splunk, or open-source solutions like SigNoz might be better suited for your needs.
What is the weakness of Datadog?
DataDog's primary weaknesses include its complex pricing model, high costs, and cloud-only deployment, which may not suit all organizations.
Which is better Splunk or Datadog?
Splunk is better for log management and analysis, while DataDog excels in providing comprehensive monitoring and observability solutions. The best choice depends on your specific use case. Alternatively, SigNoz offers a full-stack open-source APM solution that combines the best of both worlds with easy configuration and scalability.
Is New Relic a good tool?
Yes, New Relic is a good tool for monitoring and observability, offering a wide range of features and a user-friendly interface. However, if you're looking for an open-source alternative, consider SigNoz for a cost-effective and scalable solution.
Is New Relic a SIEM tool?
No, New Relic is not a SIEM (Security Information and Event Management) tool. It focuses on application performance monitoring and observability.
Is New Relic a DevOps tool?
Yes, New Relic is used in DevOps for monitoring application performance, infrastructure, and real-user interactions, aiding in continuous delivery and operational efficiency.
Is Datadog a good monitoring tool?
Yes, DataDog is a robust monitoring tool that provides extensive features for application performance, infrastructure, and network monitoring. However, if you're looking for an open-source alternative, consider SigNoz for a cost-effective and scalable solution.
What is the advantage of Datadog?
DataDog's advantages include its granular control over monitoring data, extensive integrations, and comprehensive visibility across various aspects of an application's infrastructure. Additionally, SigNoz offers a similar comprehensive monitoring solution with the benefits of being open-source.
Datadog vs New Relic Cost
Datadog is a more expensive product. It has complex SKU-based pricing, which makes it difficult for engineering teams to use the platform freely. While New Relic provides free access to its entire platform and charges based on usage. But New Relic has user-based pricing - and that can be a significant portion of your entire bill at scale.
Related Content
9x more value for money than Datadog and New Relic


