Modern software systems are inherently complex, distributed, and dynamic. Managing this complexity requires more than just traditional monitoring it demands a robust observability stack. Observability goes beyond simply tracking metrics, logs, and traces it integrates these signals to provide actionable insights into system behavior.
This guide explores how to build an effective observability stack, detailing its core components, advanced analytics, and strategies to address the challenges of modern software environments. By the end, you’ll understand how to achieve seamless visibility and faster resolution of issues in your systems.
What Is an Observability Stack and Why Do You Need One?
An observability stack is a suite of tools and practices with comprehensive insights into the behavior and performance of software systems. Unlike traditional monitoring, which focuses on predefined metrics, observability offers a deeper understanding by correlating data from diverse sources to reveal the underlying state of your systems.
Understanding Observability and Its Significance
Observability refers to the ability to infer the internal state of a system based on its external outputs. In today’s complex, distributed systems, achieving observability is critical for several reasons:
- Faster Issue Resolution: Pinpoint and address problems quickly to minimize downtime.
- Enhanced System Reliability: Maintain optimal performance by identifying potential failures early.
- Making Data-Driven Decisions: Leverage detailed insights to optimize operations and improve user experiences.
Core Components of an Observability Stack
An effective observability stack is built on four key pillars, each contributing unique insights:
- Logs: Sequential records that capture system events, aiding in detailed troubleshooting.
- Metrics: Quantitative data points, such as CPU usage or response times, offer a snapshot of system health.
- Traces: End-to-end details of requests as they traverse across distributed systems, illuminating bottlenecks and failures.
- Events: Contextual information about significant system occurrences, such as deployments or configuration changes.
These components provide a holistic view of system operations, enabling teams to identify issues and effectively uncover trends.
Why Your Organization Needs an Observability Stack
Implementing a robust observability stack delivers tangible benefits that go beyond traditional monitoring:
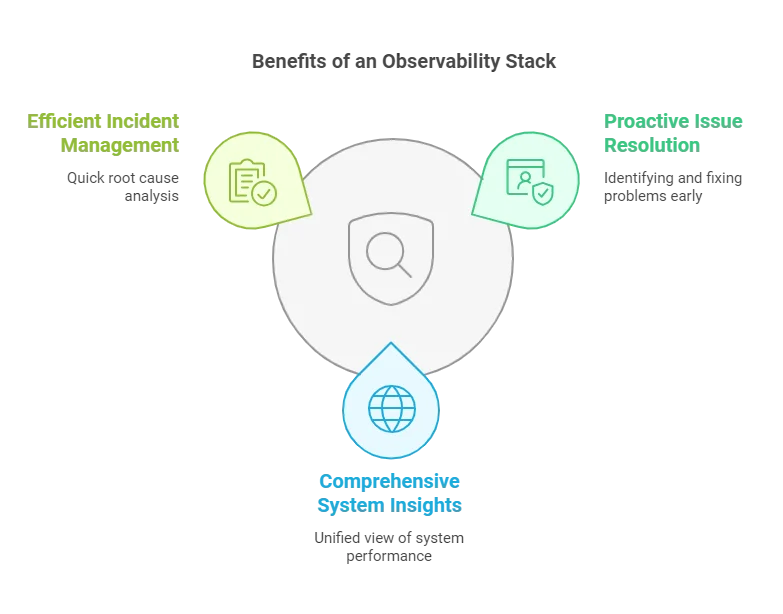
- Proactive Issue Resolution: Detect and address anomalies before they impact end users.
- Comprehensive System Insights: Gain a unified perspective of performance across applications, infrastructure, and services.
- Efficient Incident Management: Correlate data from logs, metrics, traces, and events to quickly determine root causes.
Core Pillars of an Effective Observability Stack
To build a robust observability stack, you must understand how the different telemetry signals logs, metrics, traces, and events. Traditionally described as "pillars”, at SigNoz, you can view these signals as a tightly woven mesh rather than isolated components. We've covered this topic in greater detail in our blog - Not 3 pillars but a single whole to help customers solve issues faster.

Logs
Logs record detailed events and state changes within your system, answering the “what” and “why” behind behaviors.
Best Practices for Log Management:
- Structured Logging: Use formats like JSON for easier parsing.
- Field Standardization: Include consistent fields like timestamps and severity levels.
- Retention Policies: Rotate logs and enforce limits to optimize storage.
Metrics
Metrics measure the health and performance of your system over time, helping identify trends and anomalies.
Key Considerations:
- Relevant KPIs: Focus on actionable metrics like latency and throughput.
- Avoid Over-Collection: Prevent data overload by prioritizing key indicators.
- Naming Conventions: Use clear, consistent names for efficient querying.
Traces
Traces map the lifecycle of requests, providing end-to-end visibility in distributed systems.
Important Aspects:
- Unique Identifiers: Use TraceID and SpanID for correlation across microservices.
- Sampling: Collect representative subsets to manage high trace volumes.
- Consistent Instrumentation: Standardize tracing across all services.
Events
Events capture significant occurrences, such as deployments and configuration changes, offering critical context for interpreting other signals.
Effectiveness Event Management:
- CI/CD Integration: Track deployments to correlate with system behaviour.
- Annotate Data: Use events to enrich logs and metrics for deeper insights.
- Standardized Schema: Ensure uniformity for seamless integration.
The traditional model of observability as three or four independent pillars creates a false dichotomy. In reality, these signals overlap and enrich one another, forming a mesh of correlated insights.
For instance:
- Metrics from Traces: Use trace span data to generate latency and error rate metrics.
- Logs in Traces: Add log entries to specific spans for deeper context.
- Events with Metrics: Annotate metrics with deployment events for faster issue resolution.
Imagine a web application where users report slow checkout processes. Metrics like latency and error rates help identify that the payment service is slower than usual. Logs provide context, showing repeated timeout errors from a third-party API. Traces then pinpoint the exact step in the request lifecycle where delays occur, revealing that the issue lies with API response times.
SigNoz uses this interconnected approach by leveraging a single data store for seamless correlation across signals. Observability isn't just about monitoring dashboards; it's about asking precise questions and getting answers quickly, enabling faster resolution of complex system issues.
By thinking of observability as a mesh, you gain the flexibility and depth needed to pinpoint issues in complex systems efficiently.
Choosing the Right Tools for Each Pillar
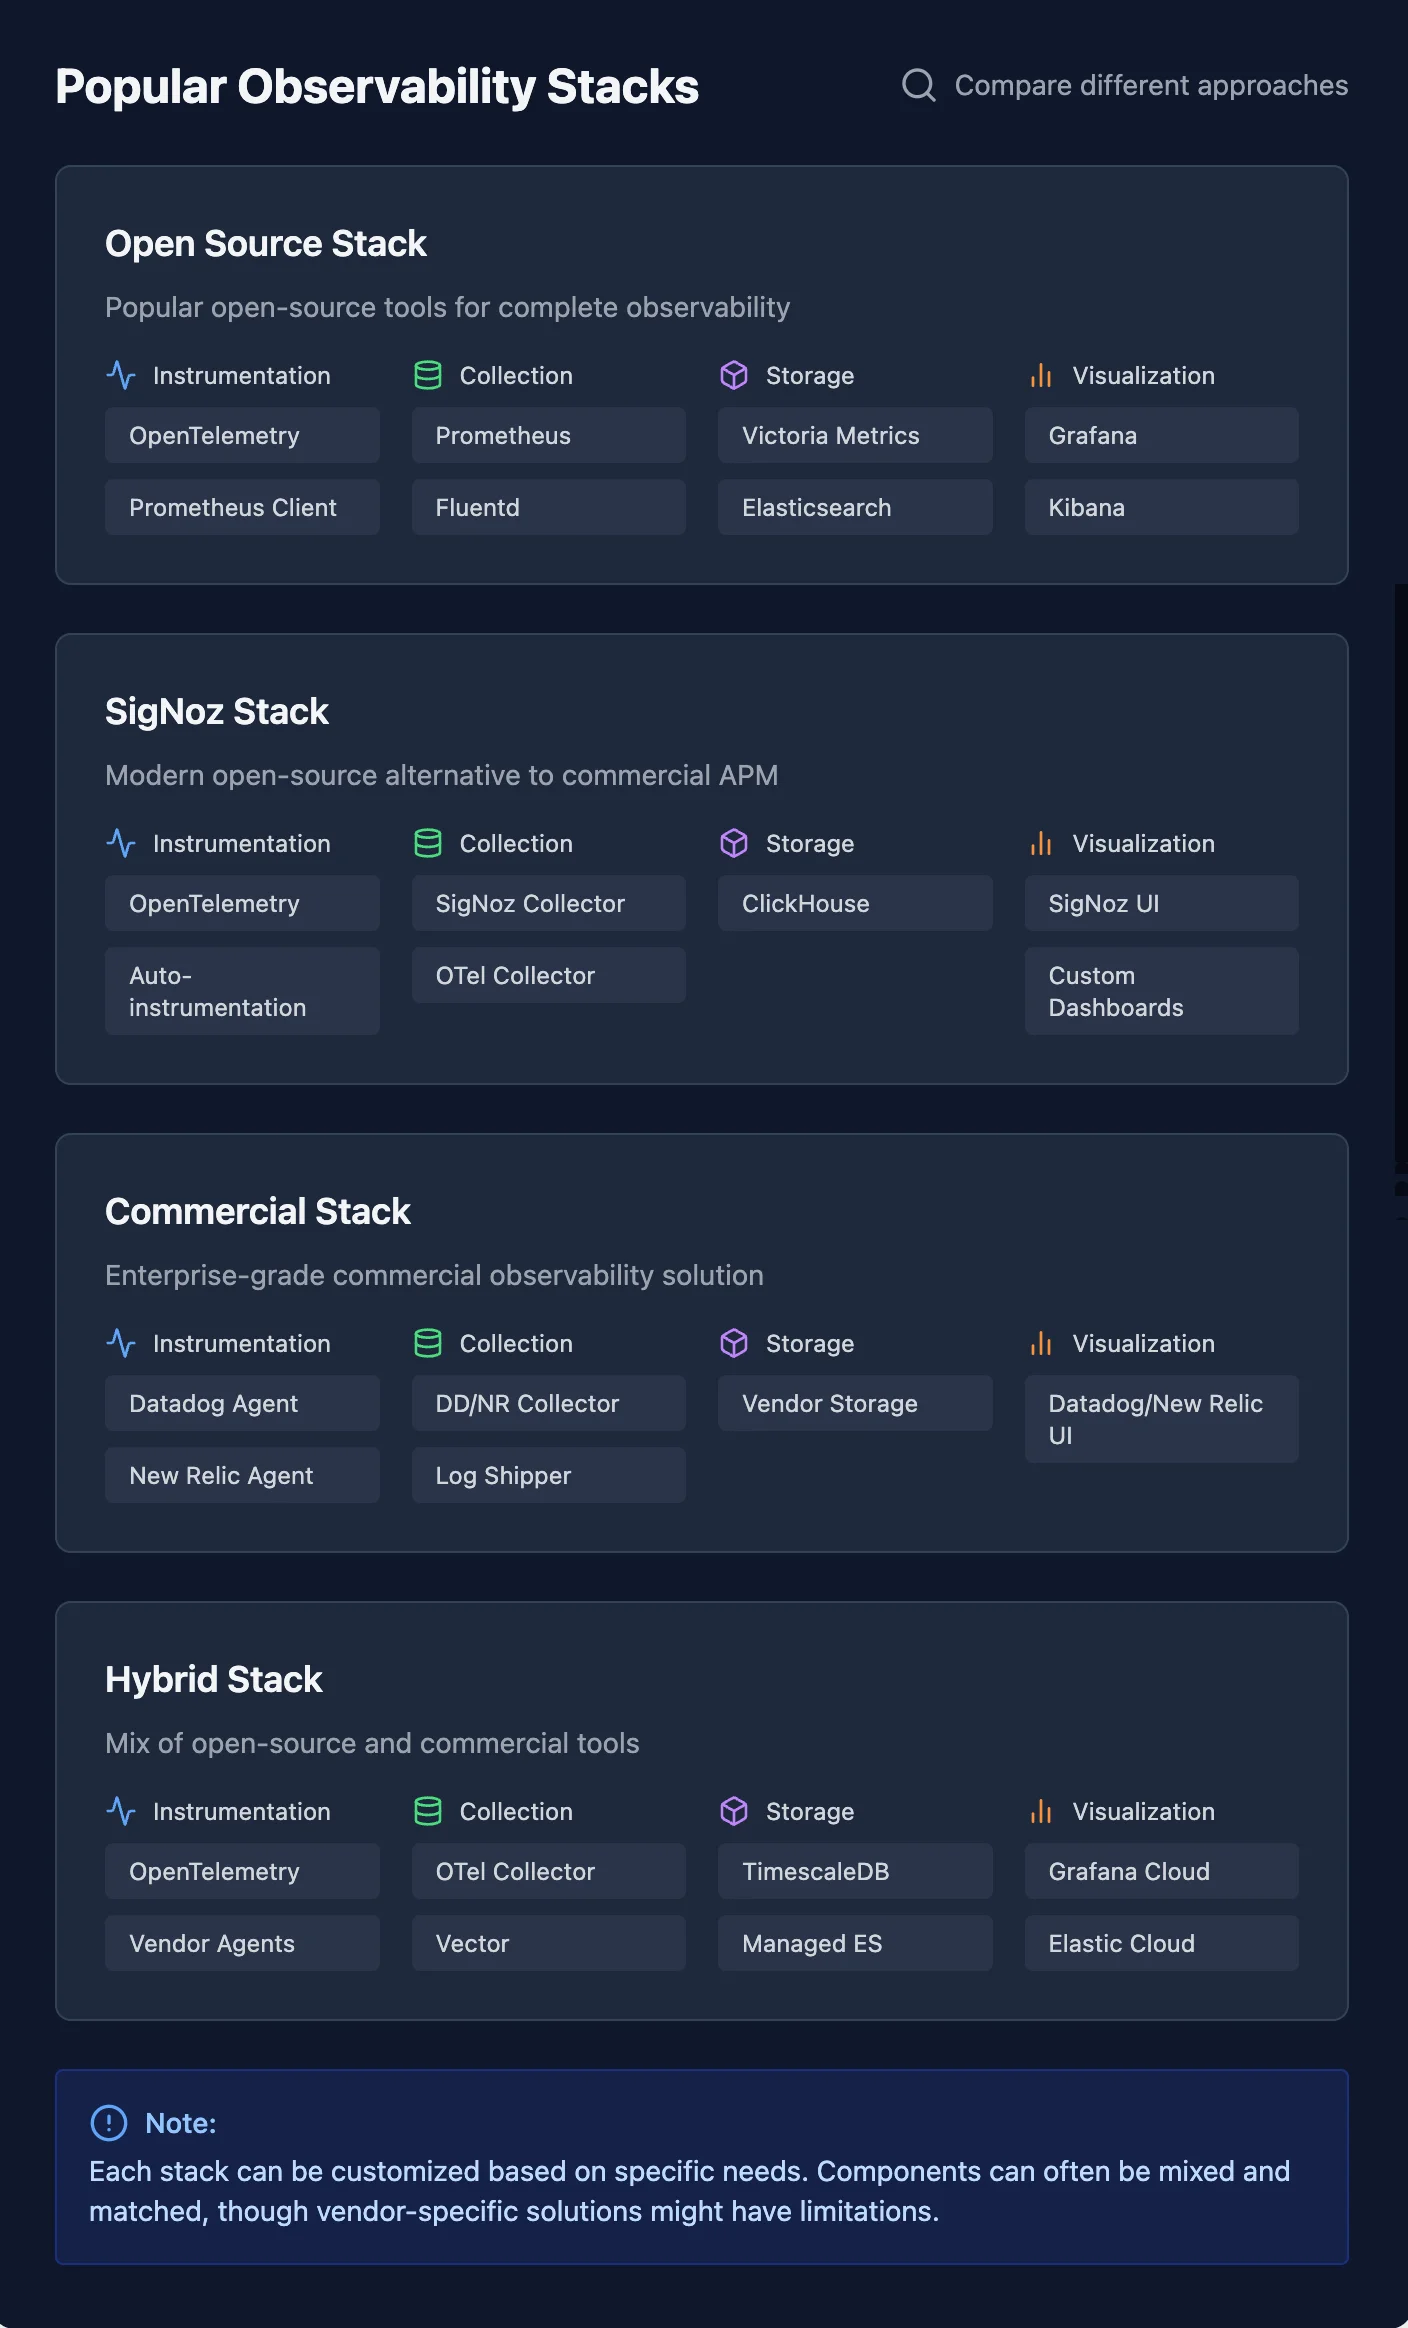
Building an effective observability stack starts with selecting the right tools. Here are key considerations to guide your decision-making process:
Key Factors to Consider
- Reliability: To ensure long-term reliability, opt for tools with a proven track record of stability, performance, and active development.
- Extensibility: Choose solutions that can scale with your growing needs, offering features like integrations, plugins, and the flexibility to adapt to new technologies.
- Ease of integration: Prioritize tools with straightforward setup processes and compatibility with your existing infrastructure to minimize deployment hurdles.
Open-Source vs. Commercial Solutions
Both open-source and commercial tools bring unique advantages to the table:
- Open-source tools
- Offer flexibility, transparency, and access to community support.
- Typically requires in-house expertise for setup, customization, and maintenance.
- Ideal for organizations seeking cost-effective, customizable solutions.
- Commercial Solutions
- Provide enterprise-grade features, professional support, and robust documentation.
- Come at a higher cost but reduces the need for internal expertise.
- Best suited for organizations prioritization fast deployment and ongoing vendor support.
Choose the Right Fit: Assess your team's skillset, budget, and operational needs to balance flexibility and support.
Integration and Compatibility
To build a cohesive observability stack, ensure your tools work together seamlessly. Look for:
- Consistent Data Formats: Select tools that produce and consume compatible data formats across logs, metrics, traces, and events.
- APIs and Plugins: Ensure the tools offer robust APIs or plugins for easy integration with other components in your stack.
- Support for Standard Protocols: Favor solutions that adhere to open standards like OpenTelemetry for interoperability and future-proofing.
How to Design Your Observability Stack Architecture
Creating an effective observability stack architecture involves strategic planning to address your system’s unique requirements. Follow these steps to design a robust and scalable stack:
1. Defining Goals and Requirements
Establish clear objectives to align your observability stack with business and operational needs:
- Service Level Agreements (SLAs): Identifying key performance and availability metrics you must meet.
- Data Retention Needs: Determine how long historical data should be stored for analysis and compliance.
- Query Workload: Estimate query volume, complexity, and frequency to ensure the stack can handle peak demands.
2. Map Data Flow and Collection Points
Understand the lifecycle of your observability data to design an efficient flow:
- Data Collection Points: Define where you’ll gather data, such as application code, infrastructure, and network layers.
- Collection Methods: Choose suitable methods like agents, exporters, or sidecars for data collection.
- Ingestion Pathways: Plan how data will be ingested into the system, whether directly, via messages queues, or using object storage.
3. Scalability and Performance Considerations
Design your architecture to handle current workloads and future growth:
- Data Partitioning and Sharding: Distribute data across nodes for efficient storage and retrieval in high-volume scenarios.
- Horizontal Scaling: Use multi-node clusters and load balancers to scale out your stack as demand increases.
- Edge Processing: Offload data processing to edge locations in distributed systems to reduce central load and latency.
4. Security and Compliance
Protect sensitive observability data and meet regulatory standards:
- Data Encryption: Secure data in transit and at rest using robust encryption protocols.
- Role-Based Access Control (RBAC): Restrict data access to authorized users and systems.
- Regulatory Compliance: Adhere to applicable standards like GDPR, HIPPA, or SOC 22 to avoid legal or financial penalties.
Implementing Your Observability Stack: A Step-by-Step Guide
Once you’ve designed your observability stack, it’s time to bring it to life with a structured implementation plan.
Instrumentation of Applications and Infrastructure
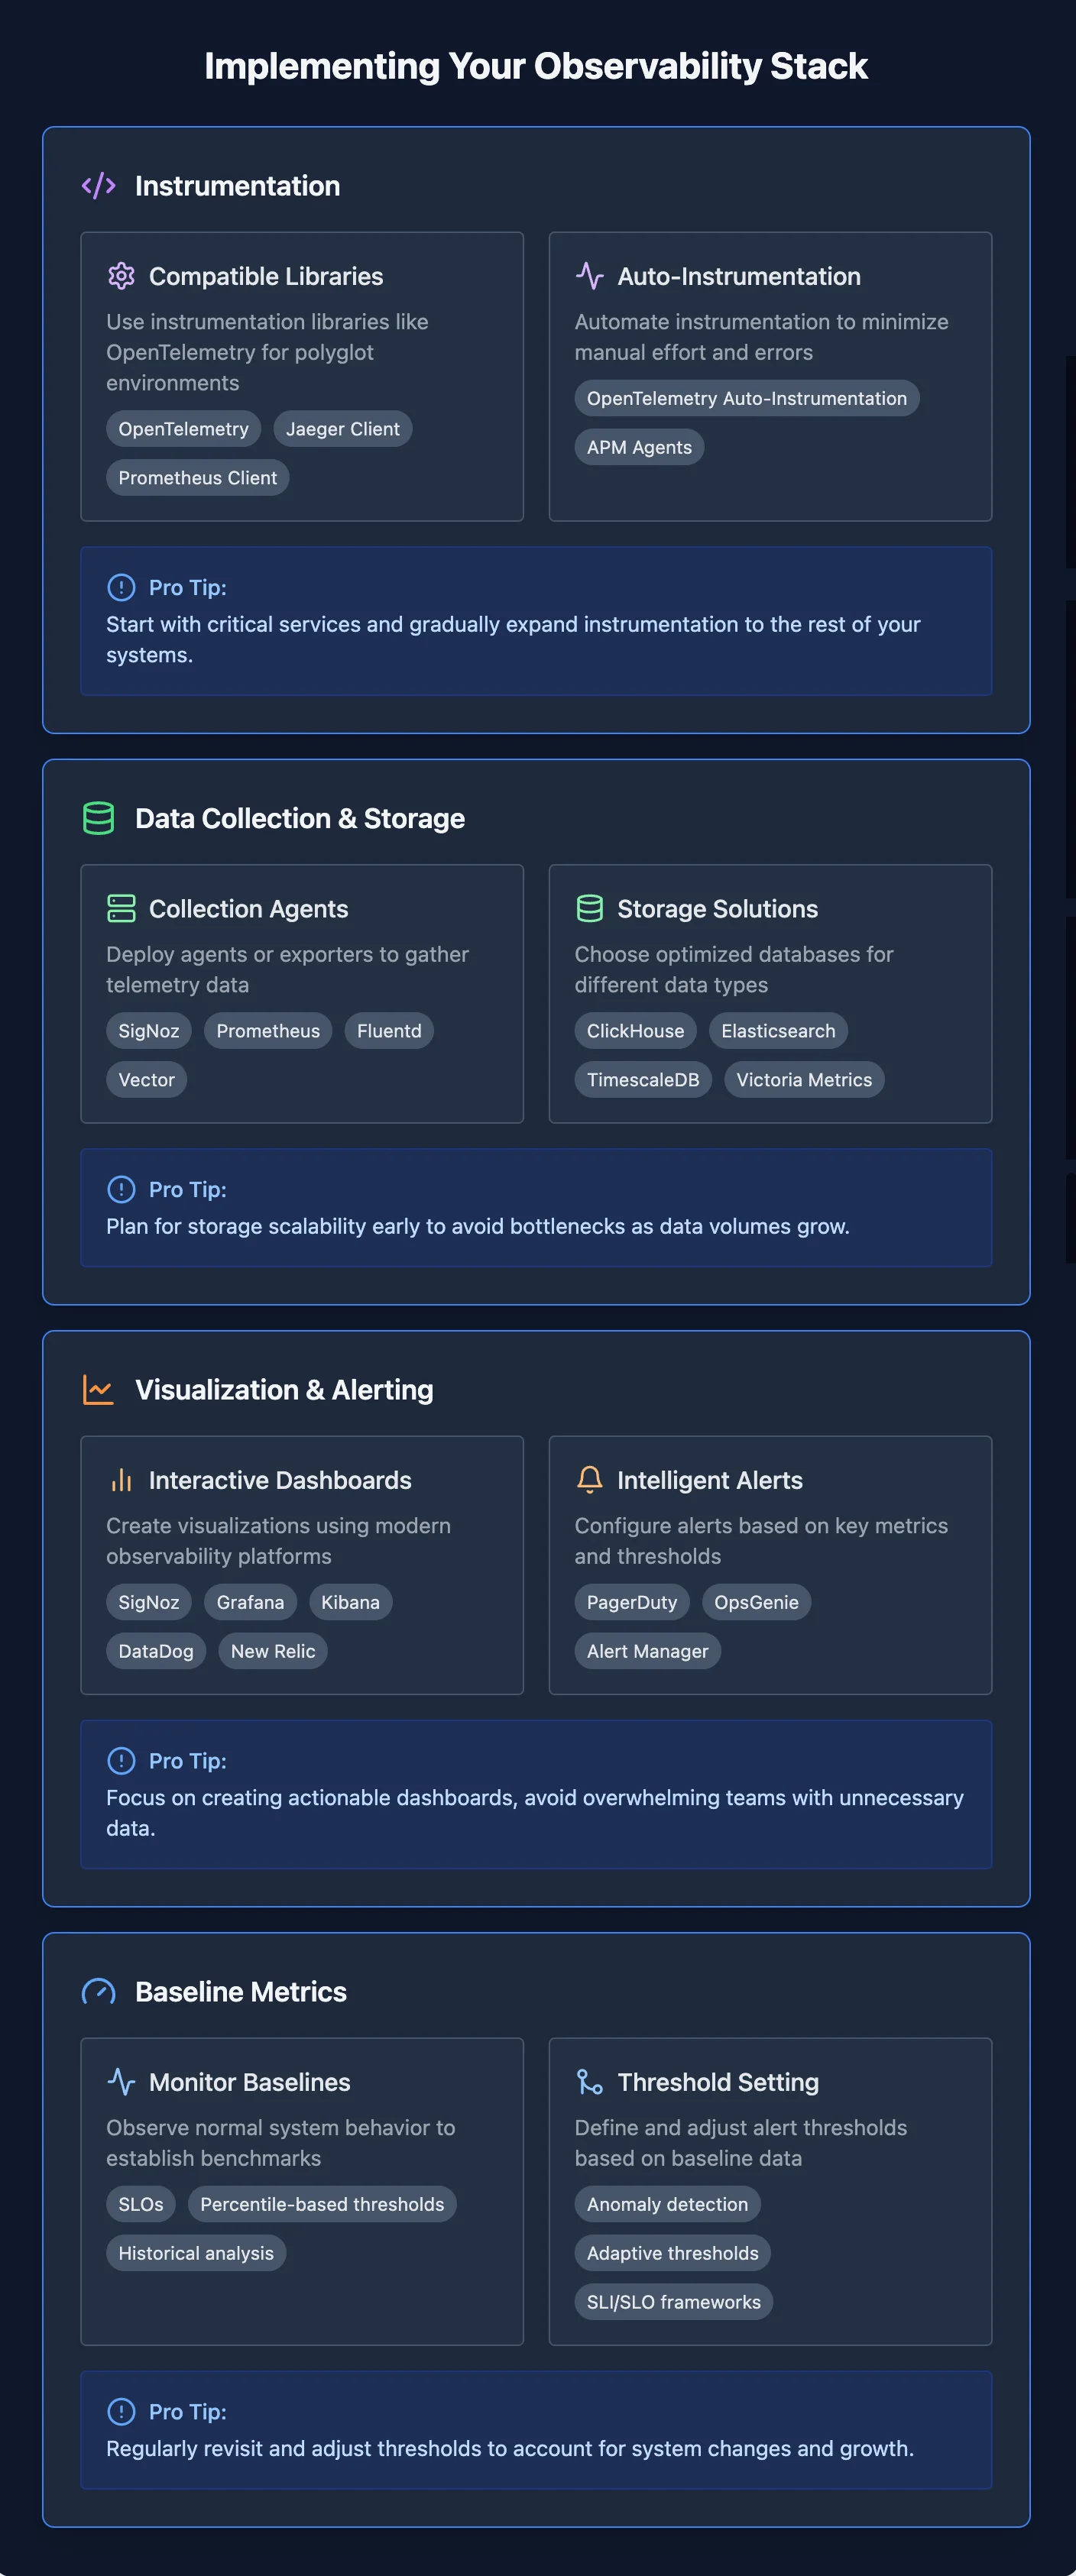
Instrumentation is the foundation of your observability stack. Here’s how to approach it:
- Select Compatible Libraries: Use instrumentation libraries tailored to your tech stack (e.g., OpenTelemetry for polyglot environments).
- Leverage Auto-Instrumentation: Automate where possible to minimize manual effort and reduce human error.
- Optimize for Performance: Balance collecting detailed telemetry data and minimizing performance overhead.
Pro Tip: Start with critical services and gradually expand instrumentation to the rest of your systems.
Set Up Data Collection and Storage
Efficient data collection and storage are essential for long-term observability.
- Deploy Collection Agents: Install agents or exporters on your systems to gather telemetry data.
- Configure Ingestion Pipelines: Use scalable solutions like Kafka for high-volume scenarios or direct ingestion for smaller setups.
- Select Storage Solutions: Opt for robust tools like SigNoz, which combines metrics, logs, and traces in one platform, or specialized databases such as Prometheus for time-series data and Elsaticsearch for logs.
Pro Tip: Plan for storage scalability early to avoid bottlenecks as data volumes grow.
Implement Visualization and Alerting Tools
Visualization and alerting bring your observability data to life, enabling proactive monitoring.
- Create Interactive Dashboards: Leverage tools like SigNoz, Grafana, or Kibana to visualize metrics, logs, and traces effectively.
- Set Up Intelligent Alerts: Configure alerts in platforms like SigNoz based on key metrics and thresholds to reduce noise and improve incident response.
- Integrate with Incident Management: Connect with tools like PagerDuty or OpsGenie for streamlined escalation and resolution workflows.
Pro Tip: Focus on creating actionable dashboards, and avoid overwhelming teams with unnecessary data.
Establish Baseline Metrics and Thresholds
Defining baselines ensures your alerting system reflects real-world conditions.
- Monitor to Determine Baselines: Observe normal system behaviour over a defined period to establish benchmarks.
- Set Initial Thresholds: Use baseline data to define thresholds for alerts, ensuring they’re neither too sensitive nor too lax.
- Continuously Refine: Regularly revisit and adjust thresholds to account for system changes and growth.
Best Practices for Data Collection and Instrumentation
Ensuring the quality of observability data begins with effective data collection and instrumentation. The following best practices will help you create a robust foundation for monitoring and analyzing your systems.
1. Leverage Automated Instrumentation
Automated instrumentation simplifies collecting telemetry data and ensures consistency across your stack. use frameworks like OpenTelemetry, a vendor-neutral standard that provides libraries and agents to instrument your applications seamlessly.
- Why it’s important: Manual instrumentation is error-prone and time-consuming. Automating it ensures all critical events are captured.
- How to implement: Integrate OpenTelemetry SDKs into your applications and configure them to export data to your observability platform.
2. Balance Data Granularity
Collecting too much data can overwhelm your storage and slow down analysis, while too little data may leave you blind to critical issues.
- Optimal granularity: Focus on capturing detailed data for key services using sampling techniques for less critical components.
Pro Tip: Start by monitoring critical paths, like request-response times for user-facing APIs, and adjust granularity as needed.
3. Ensure Minimal Overhead with Lightweight Instrumentation
Instrumentation should not significantly impact your application’s performance.
- Use efficient libraries and avoid excessive logging at high verbosity levels (e.g., DEBUG).
- Implement sampling and rate limiting to reduce the load on storage and processing systems.
4. Prioritize High-Value Metrics and Traces
Focus your data collection efforts on key metrics and spans that provide actionable insights.
- Example: Instead of collecting all HTTP requests, prioritize failed requests, latency spikes, or high-volume endpoints.
- Use dynamic filters to adjust what you monitor based on real-time conditions.
SigNoz simplifies this process by enabling targeted data collection and dynamic filtering Its powerful querying and visualization capabilities help teams focus on high-value metrics and traces without being overwhelmed by unnecessary data.
By correlating signals in a single data store, SigNoz ensures faster root cause analysis, reducing time to resolution and improving system reliability.
5. Enable Context Propagation Across Services
Tracing requires propagating context information across distributed systems. Ensure that context headers are forwarded correctly to connect related spans.
- Use trace IDs and span IDs for seamless request tracing across microservices.
- Validate integration points regularly to prevent broken trace chains.
SigNoz ensures smooth context propagation by standardizing trace ID and span ID handling across your distributed architecture. With its robust instrumentation and seamless integrations, SigNoz helps you maintain uninterrupted trace chains.
This helps for accurate correlation of events, making it easier to identify bottlenecks and optimize system performance effectively.
6. Incorporate Real-Time Data Validation
Ensure the accuracy of collected data with validation mechanisms during ingestion.
- Use schema validators to confirm that logs, metrics, and traces adhere to expected formats.
- Monitor data pipelines to detect and resolve issues, such as missing fields or incorrect values.
7. Integrate Observability with CI/CD Pipelines
Automate the validation of telemetry during deployments to catch potential issues early.
- Add smoke tests for critical observability signals in your CI/CD pipeline.
- Example: After deploying a new service, ensure telemetry data from the service is being ingested correctly.
Leveraging OpenTelemetry for a Unified Observability Approach
OpenTelemetry standardizes telemetry data collection and export with key components:
- SDKs for code instrumentation.
- Collector for vendor-neutral data processing.
- Protocols for standardized data transmission.
Implementation Tips:
- Start small with a single service or data type (gradual migration).
- Adopt OpenTelemetry for new projects (greenfield approach).
Tool Integration:
Export telemetry to popular backends like SigNoz, Prometheus, Jaeger, or Elasticsearch. SigNoz, in particular, stands out for its unified observability approach, enabling developers to monitor metrics, logs, and traces in a single interface. By centralizing observablity, SigNoz simplifies troubleshooting, accelerates debugging, and enhances overall system performance.
Ready to streamline your observability? Explore how SigNoz’s unified observability platform can transform your monitoring strategy.
Visualizing and Analyzing Telemetry Data
In observability, effective visualization transforms raw telemetry data into actionable insights, empowering teams to monitor performance, detect anomalies, and troubleshoot issues efficiently.
Effective Visualization Techniques
The choice of visualization can significantly impact how well the data is understood:
- Heat Maps: Best suited for latency distributions, helping identify performance bottlenecks and patterns.
- Line Charts: Ideal for tracking time-series metrics, such as CPU usage, memory consumption, or request rates over time.
- Gantt Charts: Crucial for distributed traces, providing a clear timeline of events across services and processes.
Dashboard and Reporting
Dashboards are essential for tailoring observability data to the needs of diverse stakeholders:
- Execute Overview: Highlight key performance indicators (KPIs), trends, and SLA adherence. Focus on summary metrics such as uptime, error rates, and cost optimization.
- Operational Dashboards: Provide detailed, real-time metrics for ongoing monitoring and alerting. Include alerts and event logs to assist operations teams with immediate responses.
- Deep-Dive Views: Focus on granular, low-level data for root-cause analysis during troubleshooting.
Advanced Analytics and Anomaly Detection
Modern observability systems leverage analytics and machine learning to enhance visibility:
- Anomaly Detection Algorithms: Identify derivations from normal patterns using statistical models (e.g., Z-Score) or ML techniques (e.g., Isolation Forests).
- Correlation Analysis: Detect interdependencies between metrics, such as how CPU spikes correlate with increased API calls.
- Predictive Analytics: Use time-series forecasting models (e.g., ARIMA or Prophet) to anticipate future resource utilization or potential system issues.
Cross-Pillar Correlation
Integrating data from metrics, logs, and traces creates a unified observability framework.
- Link Trace IDs in Logs: Provide context by mapping logs to corresponding traces, enabling a complete view of request flows.
- Annotate Metrics with Events: Mark metrics with deployment times, configuring changes, or incidents for better context.
- Use Consistent Tagging: Standardize tags across services (e.g., environment, service name) to facilitate data aggregation and comparison.
Observability in Action: Real-World Use Cases
Observability is not just about monitoring, it’s about solving real-world challenges with actionable insights. Here’s how an observability stack can address common problems effectively.
Microservices Troubleshooting
Scenario: Users report slow response times in your e-commerce app.
Solution:
- Distributed Tracing: Use SigNoz to trace the full transaction path and pinpoint the slow-performing microservice. Its intuitive UI makes it easy to visualize request latencies across services.
- Metrics Analysis: Dive into service-specific metrics like CPU, memory, and network usage using SigNoz’s built-in dashboards. Quickly identify resource bottlenecks affecting performance.
- Log Review: Centralize logs within SigNoz to search for errors or warnings associated with the impacted service. This reduces context-switching between tools.
- Event Correlation: Leverage SigNoz to correlate performance issues with recent deployment changes or configuration updates.
Result: SigNoz reveals that a database query bottleneck caused by inefficient indexing was introduced in the latest release. With this insight, you swiftly optimize the query and restore system performance.
Cloud Resource Optimization
Scenario: Your cloud costs are rising disproportionately to user growth.
Solution:
- Utilization Metrics: Track resource usage trends (CPU, Memory, Storage) over time.
- Load Correlation: Map resource consumption to user activity and application load.
- Scaling Policy Review: Examine scaling events for inefficiencies in configuration.
- Resource Assessment: Detect over-provisioned or idle instances and resize or terminate them.
Result: By fine-tuning auto-scaling and rightsizing instances, you can achieve up to a 25% reduction in cloud costs without impacting performance.
Enhanced Security Posture
Scenario: You need to strengthen threat detection and response capabilities.
Solution:
- Comprehensive Logging: Enable logging for all user authentication and authorization activities.
- Proactive Alerts: Set up alerts for suspicious patterns, such as multiple failed login attempts or unauthorized access to sensitive resources.
- Tracing user Actions: Connect security incidents with system metrics, logs, and recent changes for better context.
Result: A coordinated view across logs, metrics, and traces allows you to detect and thwart a potential data exfiltration attempt within minutes.
User Experience Improvements
Scenario: You aim to reduce cart abandonment rates in your e-commerce application.
Solution:
- End-to-end Tracing: Map the entire checkout flow to identify delays at each step.
- Performance Metrics: Measure the response times of API calls, page load speeds, and backend operations.
- Behaviour Correlation: Link performance metrics to user behaviour, such as drop-off rates at specific stages.
- Component Optimization: Address bottlenecks like slow-loading components or high-latency API endpoints.
Result: By reducing the average checkout time by 40%, you can achieve up to a 15% drop in cart abandonment, directly booting sales.
Overcoming Common Challenges in Observability Implementation
Implementing an observability stack involves several hurdles. Here’s how to address them efficiently:
Managing Data Volume and Storage Costs
- Use intelligent sampling to reduce high-cardinality data.
- Opt for tiered storage (hot, warm, cold) based on access frequency.
- Compress data to balance storage needs and data fidelity.
Simplifying Tool Sprawl
- Standardize tools to cover all observability pillars.
- Adopt OpenTelemetry for unified data collection.
- Centralize data aggregation on a single observability platform.
Ensuring Data Accuracy and Reliability
- Perform data validation during collection and ingestion.
- Use redundancy for critical systems data collection.
- Regularly audit and test instrumentation.
Fostering Organizational Culture
- Train teams on observability tools and concepts.
- Promote cross-functional collaboration among developers, operations, and SREs.
- Adopt observability-driven development practices.
Future Trends in Observability
Stay ahead of the curve by keeping an eye on these emerging trends:
AI and Machine Learning
- Enable predictive analytics for proactive resolutions.
- Use Natural Language Processing(NLP) interfaces for intuitive data queries.
- Automate root cause analysis and recommendations.
Observability-Driven Development (ODD)
- Integrate observability into the development lifecycle.
- Use telemetry data to prioritize features and manage technical debt.
- Continuously verify system behaviour in production.
Extended Berkeley Packet Filter (eBPF) and Next-Generation Tracing
- Integrate observability into the development lifecycle.
- Use telemetry data to prioritize features and manage technical debt.
- Continuously verify system behaviour in production.
Edge Computing and IoT
- Collect and process telemetry data at the edge.
- Ensure data synchronization in intermittently connected environments.
- Address privacy and security in distributed IoT systems.
Streamlining Your Observability Stack with SigNoz
SigNoz is an open-source, full-stack observability platform that can simplify your observability journey.
SigNoz offers a unified platform for logs, metrics, and traces, delivering:
- A scalable backend for efficient data storage and processing.
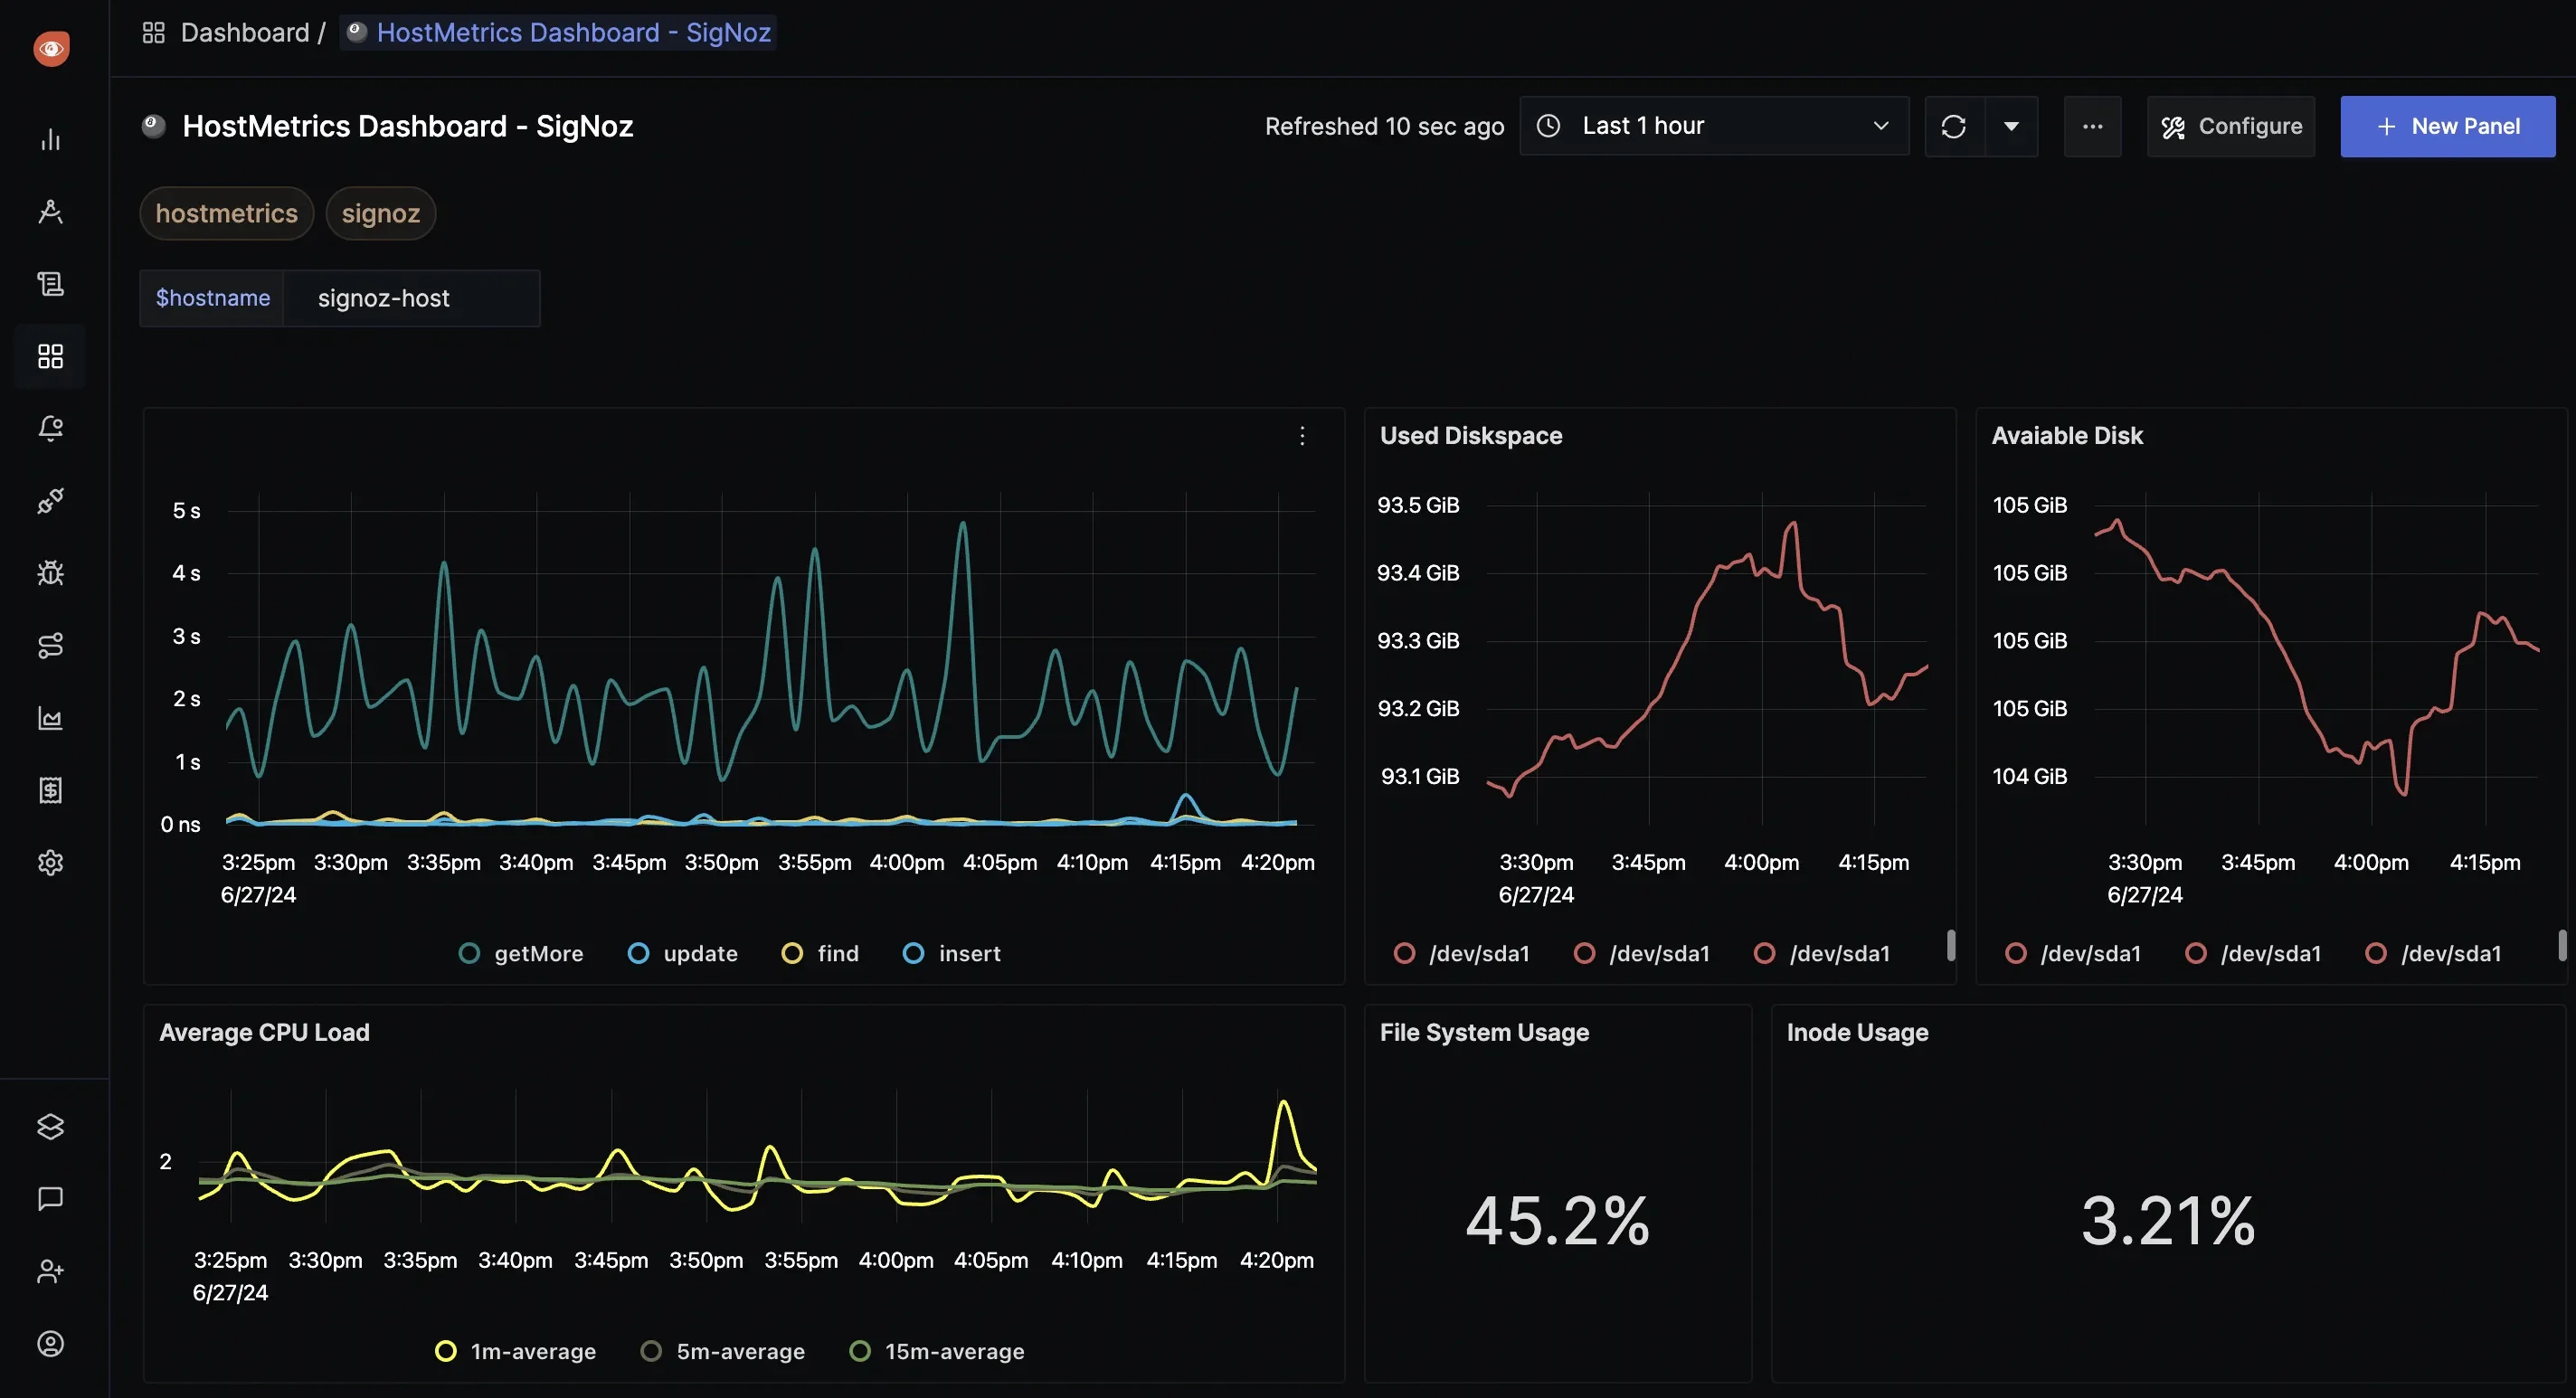
- An intuitive user interface for visualization and analysis.
- Native support for OpenTelemetry for standardized data collection.
Key Features and Benefits
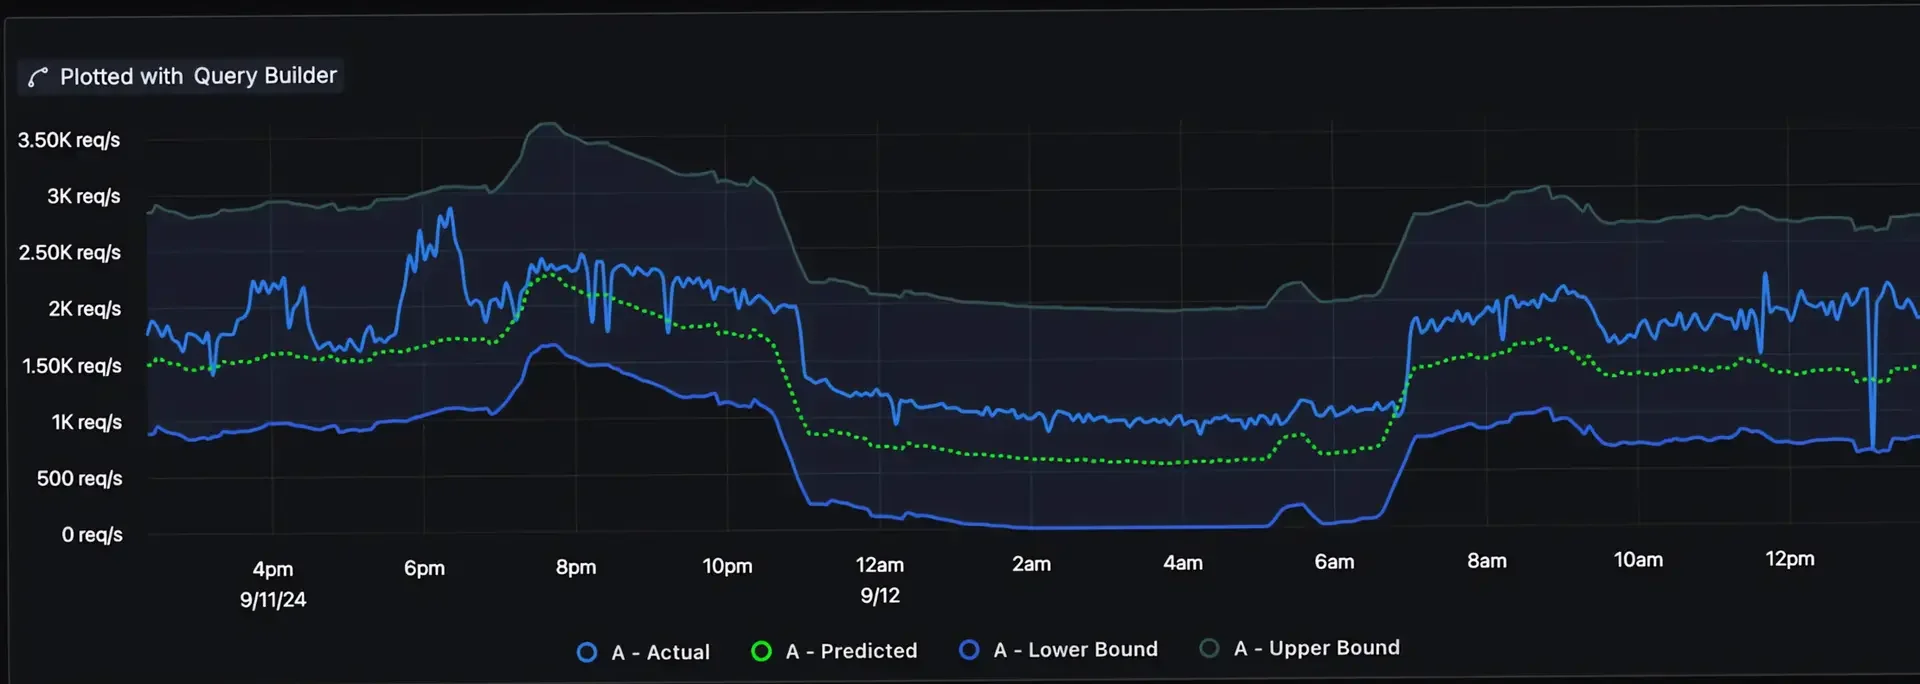
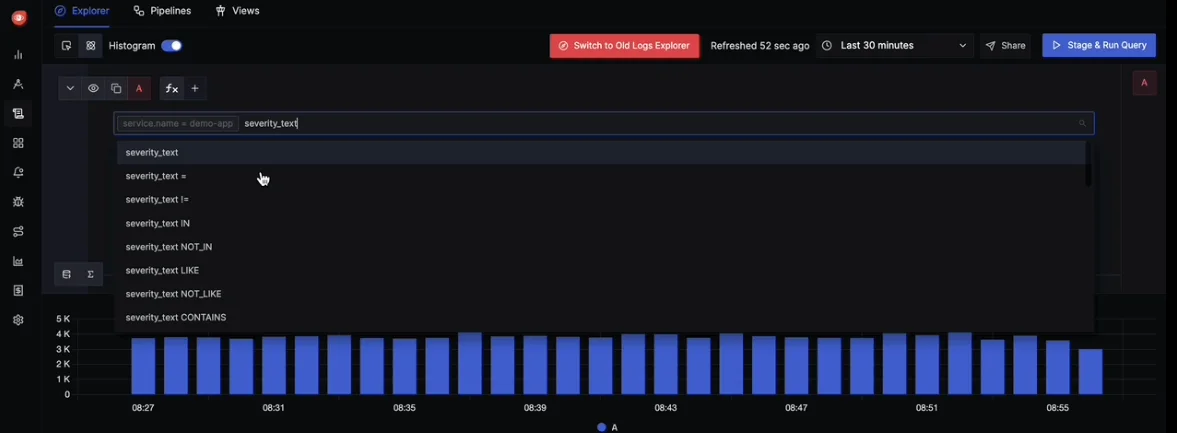
- Unified dashboards for correlated insights across logs, metrics, and traces.
Getting Started with SigNoz
To begin using SigNoz:
- Deploy SigNoz using Docker Compose or Kubernetes (Helm).
- Instrument your applications using OpenTelemetry SDKs.
- Configure the OpenTelemetry Collector to route data to SigNoz.
- Access the SigNoz UI to visualize and analyze data.
Cloud vs. Open-Source
SigNoz offers both cloud-hosted and self-hosted options:
- SigNoz Cloud: Managed solution with automatic updates and scaling.
- Open-Source: Self-hosted for complete control and on-premise deployment.
Select the option that best suits your expertise, budget, and compliance needs.
Key Takeaways
Creating an effective observability stack is essential for managing the complexities of modern software systems. Here are the core principles to guide your approach.
- Ensure your stack incorporates all four pillars: Logs, metrics, logs, and events, for holistic system visibility.
- Opt for tools that seamlessly integrate and scale with your evolving needs while avoiding tool sprawl.
- Architect your observability stack with scalability, security, and compliance as foundational elements from the outset.
- Leverage OpenTelemetry for consistent, vendor-agnostic data collection and export to maintain flexibility.
- Adopt effective visualization techniques and cross-pillar correlation to derive actionable insights quickly.
- Address challenges like high data volumes and integration complexity with strategies such as intelligent sampling, tiered storage, and centralized platforms.
- Keep pace with advancements like AI-driven analytics, eBPF-based tracing, and observability-driven development practices.
By implementing these strategies, you’ll build an observability stack that delivers deep insights, accelerates troubleshooting, enhances performance, and supports strategic decision-making for modern, distributed systems.
FAQs
What's the Difference Between Monitoring and Observability?
Monitoring focuses on predefined metrics and statuses, while observability provides a more comprehensive view of system behavior. Observability allows you to ask new questions and understand unknown issues by collecting and analyzing detailed telemetry data.
How Do I Choose Between Open-Source and Commercial Observability Tools?
Your decision depends on your unique needs:
- Budget: Open-source tools are cost-effective but may require significant in-house expertise. Commercial tools are higher-cost but include robust support.
- Customization: Open-source tools offer flexibility for custom solutions. Commercial tools may have less customization but are user-friendly.
- Support Needs: Commercial tools provide dedicated customer support, open-source tools rely on community support.
- Integration: Ensure the tool fits seamlessly into your existing tech stack.
Evaluate your team’s skills, budget, and system requirements to make the right choice.
Can I Implement an Observability Stack in a Legacy System?
Yes, implementing observability in legacy systems is possible, but it may require extra effort. Steps to get started:
- Start Small: Begin with basic log analysis and infrastructure monitoring.
- Gradual Instrumentation: Introduce metrics and tracing incrementally.
- Standardization: Use OpenTelemetry libraries to collect consistent telemetry data across components.
- Use Sidecars or Agents: For systems that can’t be directly instrumented, leverage external helpers like Sidecars.
How Does Observability Impact DevOps Practices?
Observability is a game-changer for DevOps, enhancing key workflows:
- Faster Incident Response: Quickly detect, diagnose, and resolve issues.
- Improved Collaboration: Foster shared visibility and understanding across development and operations teams.
- Data-Driven Decisions: Leverage insights to make informed improvements.
- Continuous Improvement: Iterate on system performance using real-world feedback.
- Shift-Left Testing: Embed observability principles early in thee development lifecycle for proactive problem-solving.
